The education sector around the globe has seen profound reshaping due to the impact of artificial intelligence (AI). Through its personalized learning algorithms, various adaptive platforms, and automation, AI has reconstructed the way how education is delivered and managed. These developments have led to adapting Education to individual needs. One of the main advantages of AI in education is its ability to offer personalized learning. Every student is unique, with different learning paces and comprehension styles. It has also helped Universities with automated grading, and intelligent tutoring systems and providing smart classrooms accessible to everyone. However, amongst the transformational potential of AI, the education sector is not resistant to broader geopolitical challenges, particularly economic recessions in major countries and conflicts between nations.
Economic recessions in a country like the United Kingdom have led to cuts in the funding of the education sector which have resulted in various causes of resource shortages and reduction in the programs. Moreover, the international mobility of the students may be hindered due to visa restrictions, resulting in low enrollments also removal of Graduate Route visa which allows graduates the opportunity to stay and gain work experience in the UK for at least two years after completing their degree has impacted the admissions. Students from India show signs of being deterred from applying to British universities with a 4 per cent drop in applications to the UK.
Until August 2023, Canada stood among the top foreign study destinations for Indian students. However, a shift occurred in the latter half of the year when political tensions arose between Indo Canadian relationship over the death of some anti-India terrorists which were being harbored in. Canada. This saw a sharp 86% decline in India students who applied to Canadian Universities.
Despite the above challenges India is the single largest driver of growth for universities across the world and the largest market for international students. The trends shaping the admission of 2024 show an almost 35% year on year increase in Indian students going to study abroad. It is increasingly clear that India’s international student demographic is particularly profound in Australia, Canada, the UK, and the United States.
Governments and educational institutions can invest in their digital infrastructure to strengthen remote learning, which will ensure continuity in the delivery of education during economic downturns and beyond. The academic industry and the government can collaborate to drive innovation and use AI as its leverage to ensure educational solutions. This will help to address the learning gaps and will ensure enhanced student outcomes. Thus, by investing in the digital infrastructure and promoting skills development, stakeholders can harness the power of AI to create a more inclusive and resilient education system for the future.
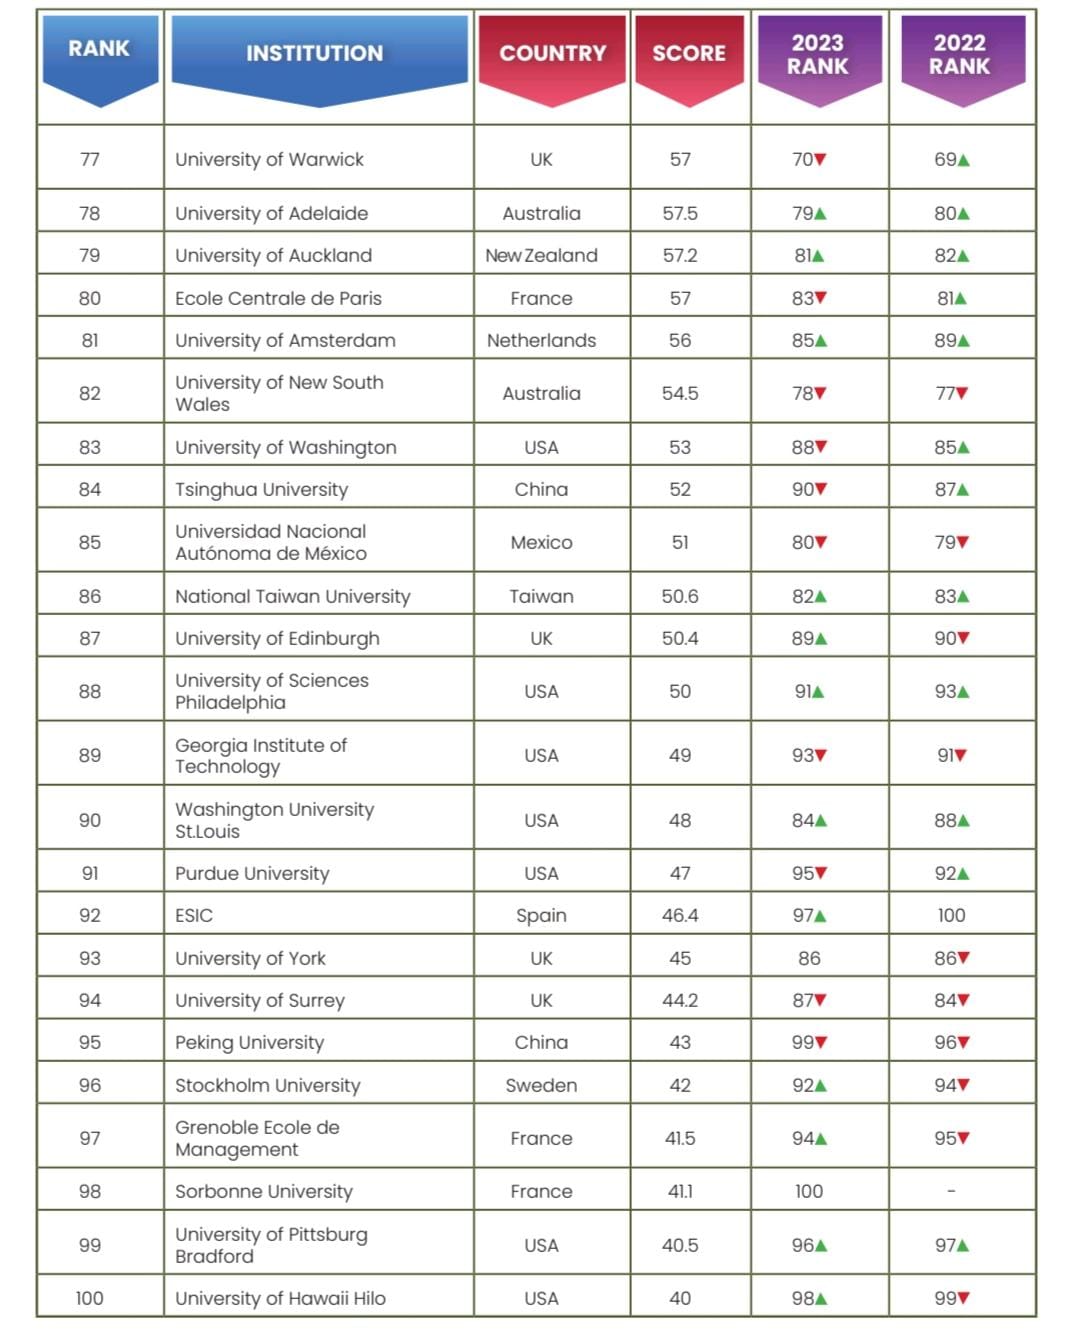
If you are a student wishing to pursue education on foreign shores, it is important for you to keep all these factors in mind before making your decision. To help with this, Youth Incorporated has released the top 100 Global Undergraduate University Rankings 2024 in association with The Times of India. This list is curated with an immense amount of research to analyse the global reputation of many renowned universities, with the aim of helping students make informed decisions.
Analysis
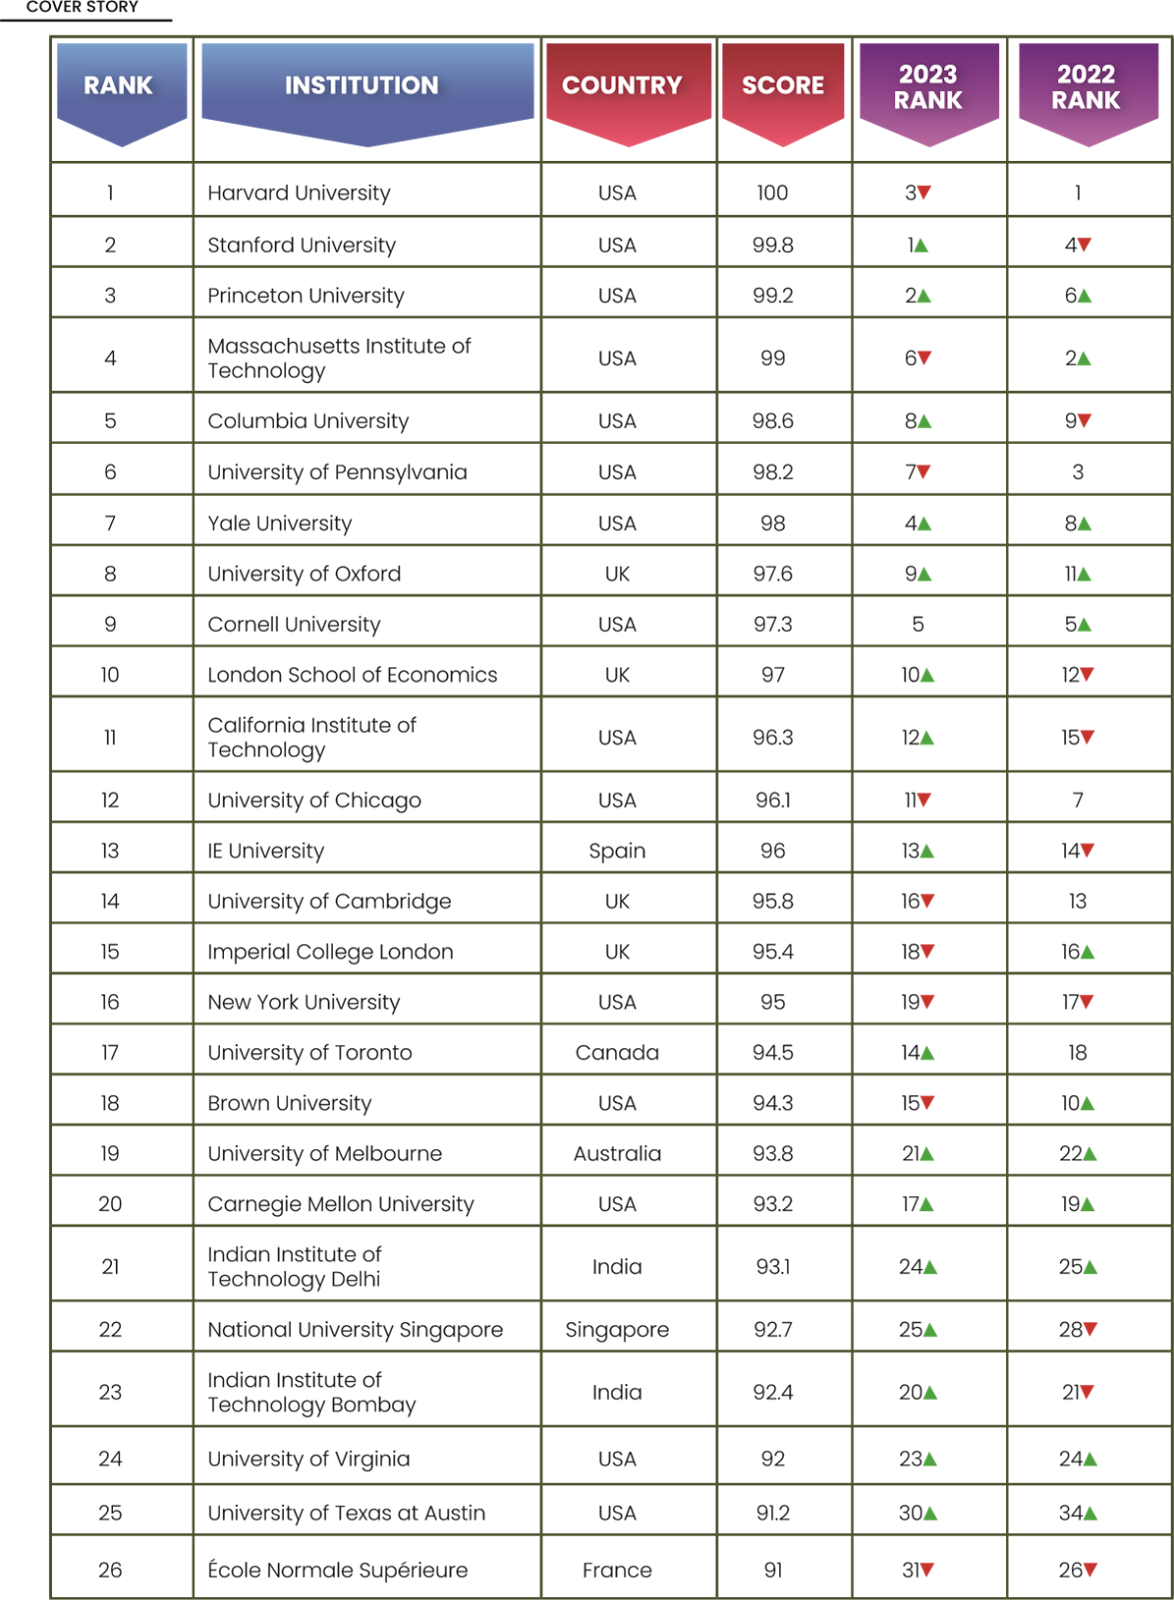
The Global University Rankings 2024 haven’t seen a lot of shift this year for universities. Harvard University has reclaimed the first position this year after it fell to third in 2023. In the second position is Stanford University, which lost its crown of the first position from 2023. Princeton University has ranked third this year, after ranking second in 2023 and sixth in 2022. Climbing up the ladder after falling to sixth in 2023 and losing its second position in 2022, MIT has ranked fourth this year. Columbia University has gone up three positions from 2023, placing itself in the fifth rank this year. University of Pennsylvania has ranked sixth this year, after ranking seventh in 2023 and third in 2022. Yale University has dropped down to seventh this year, after ranking fourth in 2023. Placing itself in the eighth position, climbing up one rank from last year, the University of Oxford is going up slowly and steadily. Cornell University has surprisingly dropped down to ninth this year, after holding the fifth rank for the past two years. The London School of Business has held its tenth position this year as well, staying in the top 10 global university rankings in 2024. It is evident that the UK and the USA still hold hegemony over the top 10 universities, keeping them the best study destinations for students to date.
Ranking Methodology
We chose institutes across the world after having discussions with thousands of students, recruiters and faculty. Youth Inc’s Research Unit (YRU) also studied domestic rankings in various countries to find the best institutes.
We sent survey links to 2625 institutes and provided them with unique codes so that they could submit their responses online. Institutes were also provided links to online surveys where their current students were asked to rate specific statements that pertained to the factors considered in this ranking. Institutes also sent separate survey links to their recruiters who in turn rated the institute’s career management cell as well as student employability.
Over 9550 additional recruiters were sent emails with a survey link. The recruiter list was prepared from the responses of the institutes and also included internationally well-known recruiters.
Below are the factors we considered and the overall weightage assigned to them:
Careers, Recruitment and Industry viability of students – 55%
Diversity and International Outlook – 10%
Innovation – 10%
Campus, Extracurricular activities, Exchange programmes – 15%
Money, Student Satisfaction – 10%
Careers, Recruitment and Industry viability of students – 55%
This category significantly impacts the overall score of an institute since it is the most weighted factor. One of the most important criteria for selecting institutes is the student’s industry viability after graduation.
Recruiters were asked to list and rate the institutes that they were most likely to recruit from. They were asked about the likelihood of recruiting again from the same institute and their satisfaction with the institute’s career cell. Recruiters rated students on various factors including analytical and problem-solving skills, leadership potential, communication and interpersonal skills and so on.
Institutes, students and alumni were also asked about the availability and functioning of a career service cell on campus and how active such a service was. We also considered what percentage of students were actually placed, both domestically and internationally, through the institute’s career service cell. Students reported the availability and ease of obtaining internships.
Diversity and International Outlook – 10%
This category looks not only at the diversity of faculty but also at the diversity of students in class. The international outlook includes international students who are attracted and retained by the institute.
Institutes were asked to report the total number of students on campus and what percentage of the students were international and spoke two or more languages. Gender diversity of the students was considered.
Institutes also reported the percentage of the faculty that were international, held a doctorate and were accredited with their own publishing material along with the gender diversity of the faculty.
Students and alumni were asked to rate the student and faculty diversity in their class.
Innovation – 10%
This category looks at the innovation used to construct and teach programmes and how faculty engage the students; an important factor in the overall perception of an institute.
We considered the different ways in which an institute constructs programmes. Institutes were asked to select from a list of different teaching methodologies that we considered innovative – some of these included company visits, dual or multiple majors and course collaborations between different departments at the institute. Our list was made after surveying students across different campuses worldwide.
Students were asked to report how satisfied they were with faculty who used innovative ways to teach subjects.
Campus, Extracurricular activities, Exchange programmes – 15%
This category considers the support students receive on campus and the availability of extracurricular activities. The exchange programmes offered by the institute and how actively students are encouraged to opt for such programmes was also considered.
We asked the institutes to select the different types of assistance provided by the student office or a similar body on campus. Our initial list was selected after surveying students across different campuses worldwide.
Students and alumni reported that they were encouraged by the institute to participate in different extracurricular activities on campus.
Institutes were asked to report the percentage of students that opted for exchange programs. We also considered the exchange students present on the institute’s campus.
Money, Student Satisfaction – 10%
This category takes into account a critical part of college education today – finances. And more importantly, how satisfied a student is with the institute.
We considered students’ opinions on whether a particular institute was perceived as ‘value for money’. We also asked institutes to state the percentage of students who received some sort of funding from the institutes.
Students and alumni were asked to rate their institutes on various factors including attitude of staff and professors, location, course content and so on and institutes were asked to report the graduation rate of students enrolled and what percentage of students transfer out of the institution.
Scores
We calculated the standard deviation and standard scores (Z scores) so that we could combine and analyse the data with more accuracy and reliability. Below is a summary of the factors and the weightage given to each factor when we ranked the institutes. Each factor was made up of a set of questions. The total percentage attributed to that factor was based on the average score of the responses multiplied by the assigned weightage. The total scores were then sorted from highest to lowest. The institute with the highest score was ranked first.
| . | Institute | Current students | Alumni |
| Career Service | 3% | 1% | 1% |
| Diversity of Faculty | 3% | 1% | 1% |
| Diversity of Students | 3% | 1% | 1% |
| Innovation of Programs | 3% | 1% | 1% |
| Innovation in Teaching Methodologies | 3% | 1% | 1% |
| Campus Support | 3% | 1% | 1% |
| Extracurricular Activities | 3% | 1% | 1% |
| Exchange Programs | 3% | 1% | 1% |
| Value for Money | 3% | 1% | 1% |
| Student Satisfaction | 3% | 1% | 1% |
| 30% | 10% | 10% |
| Recruiters | |
| Recall of institute where to recruit from | 20% |
| Likelihood of recruiting from the same institute again | 20% |
| Satisfaction with institute career cell | 10% |
| 50% |
Not just numbers
After we calculated the total computed scores for the institutes, we subjectively analyzed the data provided by the institutes, current students, and recruiters. If we found discrepancies in the satisfaction scores and the subjective descriptions, we omitted the data. This happened in the case of 12 institutes.
Missing Data
On a few rare occasions, some institutes did not supply data for all the questions in the survey. When data was missing which affected factors which were low-weighted such as value for money or campus support, we entered an estimate between the average and the lowest value reported by the institute.
By following such a practice, we did not excessively penalize an institution with a ‘zero’ for data that it could not provide. At the same time, the institute was not rewarded.
Exclusion of Institutes
We required that at least 20% of the class size (of any specific institute) answer the student survey. Hence, some institutes were disqualified from our ranking because of a lack of responses to the student and/or alumni survey.
Institutes that did not fill out the survey reports in time
17% of the institutes contacted did not complete the survey on time or did not respond. We used publicly available information on some of these institutes to include them in our ranking. We also contacted current students and recruiters of these institutes and compared the data we received with the data from institutes that participated in our survey.