Good times become good memories and bad times become good lessons. What the world has gone through in the last 2 years is totally unprecedented and it caused a major disruption to all of our lives in so many ways. We have spent time at home with family and learnt so many new skills or lessons which would probably never happen otherwise. It has been a roller coaster of emotions with despair, fear, uncertainty on one side and then hope with the vaccine, security, bonding and so much more. The common thread is that humans learnt so many new things and changed the way we live, learn, adapt and grow. So education never stalled but just changed its form and format!
Educational institutions had to look for alternatives to keep the academics of their students intact. As a result, they turned to technology and the internet for help. Online education today has climbed one step higher making use of metaverse and developing digital universities to educate students across the globe. Now with the number of COVID infections falling under manageable figures, the countries have opened their gates once again to students willing to pursue higher education.
Now, with education gradually coming back on track, there has been a sudden surge of admission applications to universities worldwide. This has put the universities under pressure to admit the fittest and most deserving students making admissions of students more challenging than ever. Due to excess applications and limited availability of seats, the universities have set certain parameters to ensure a fair and pragmatic selection process. The most important one is setting a cut off of GMAT scores for the applicants. Only those who have the required GMAT scores move upward in the selection process. Other factors which later come into play are extracurricular activities, work experience if any, inter-personal skills, etc. This indicates that students need to be focused and decisive if they truly wish to get into their dream university. Making this decision can be back-breaking. So, just like every other year, this year too Youth Incorporated, one of India’s youth magazines in association with Education Times has released its top 100 Global Undergraduate Rankings 2022 to assist you in making an informed decision of choosing the best and most suitable university for the purpose of higher studies. The rankings are categorized based on the location and course specialization of these universities.
How Have The Universities Fared This Year As Compared To 2020 And 2021
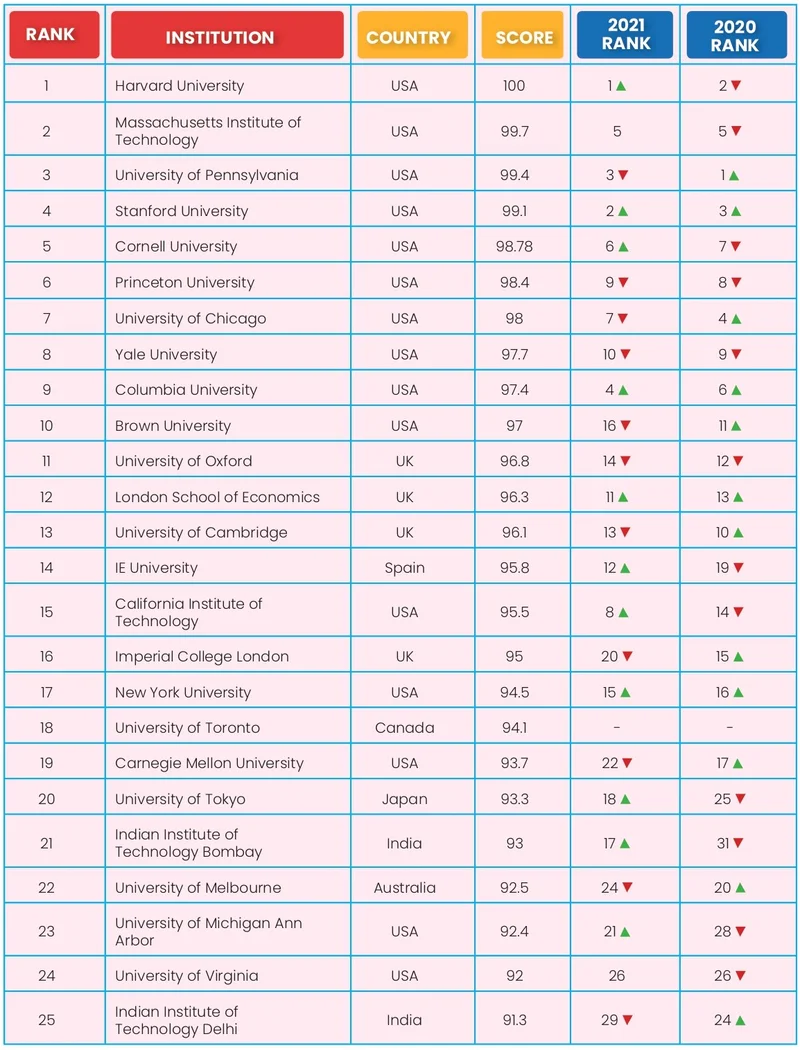
It is good to see one of the world’s most popular and renowned universities, Harvard University maintain its top rank in the second consecutive year after ranking 2nd in 2020. Massachusetts Institute of Technology has sat back on its 2nd rank after being on the 5th position in 2020 and 2021. The University of Pennsylvania has maintained its 3rd position like last year. Stanford University’s rank has slipped down from 2nd and 3rd position in 2021 and 2022 respectively, to the 4th position. Taking one jump ahead, Cornell University has now occupied 5th position as opposed to its 6th position in 2021 and 7th in 2020. From 9th position in 2021, Princeton University has taken a high jump occupying the 6th position. After ranking 4th in 2020, the University of Chicago has been holding the 7th position since 2021. Yale University has climbed up the ladder securing the 8th position after sliding down to the 10th rank in 2021. Columbia University stands on the 9th position this year after being on the 4th rank in 2021 and 6th in 2020. This has indeed been a sharp fall for the university. Safely securing the 10th rank is Brown University which was way below on 16th position in 2021 and on the 11th in 2020. Rising from the 14th position in 2021 to the 11th in 2022, we hope to see the University of Oxford fall under the top 10 undergraduate universities of the world.
It is important to note that in 2022, all the universities of the USA and the USA only have become the Top 10 Undergraduate Universities Of The World. This once again has proved that USA continues to remain the best destination for students to pursue their higher education from.
What does the Indian Picture look like?
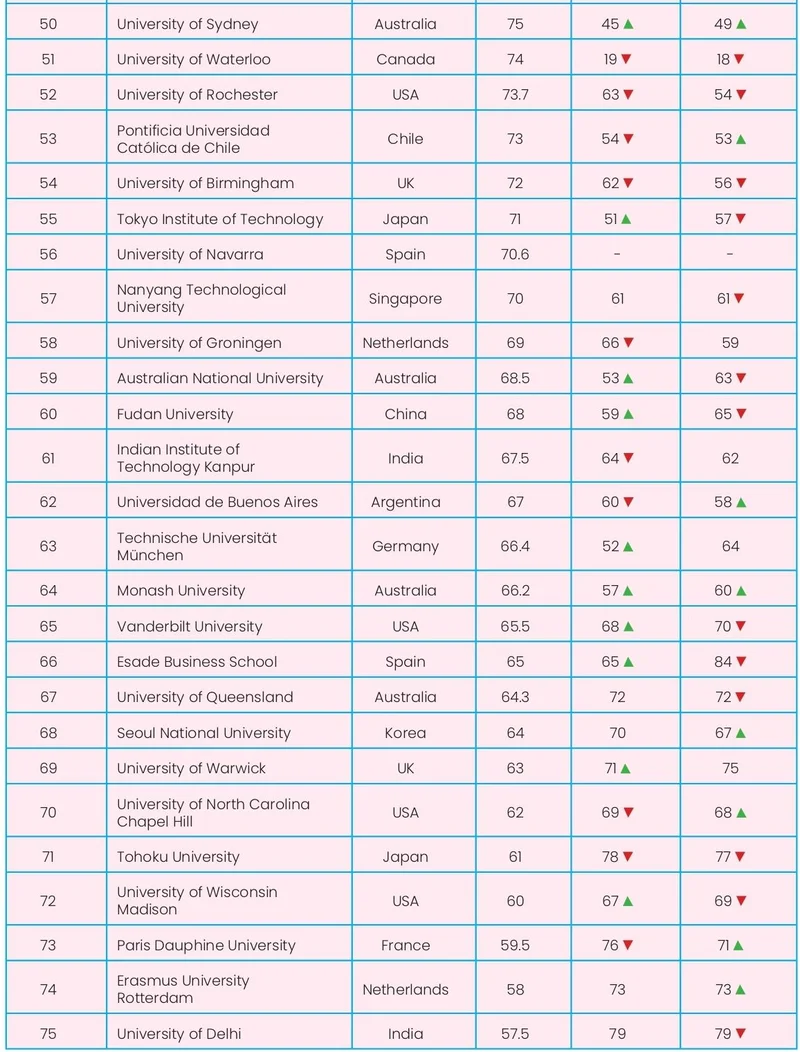
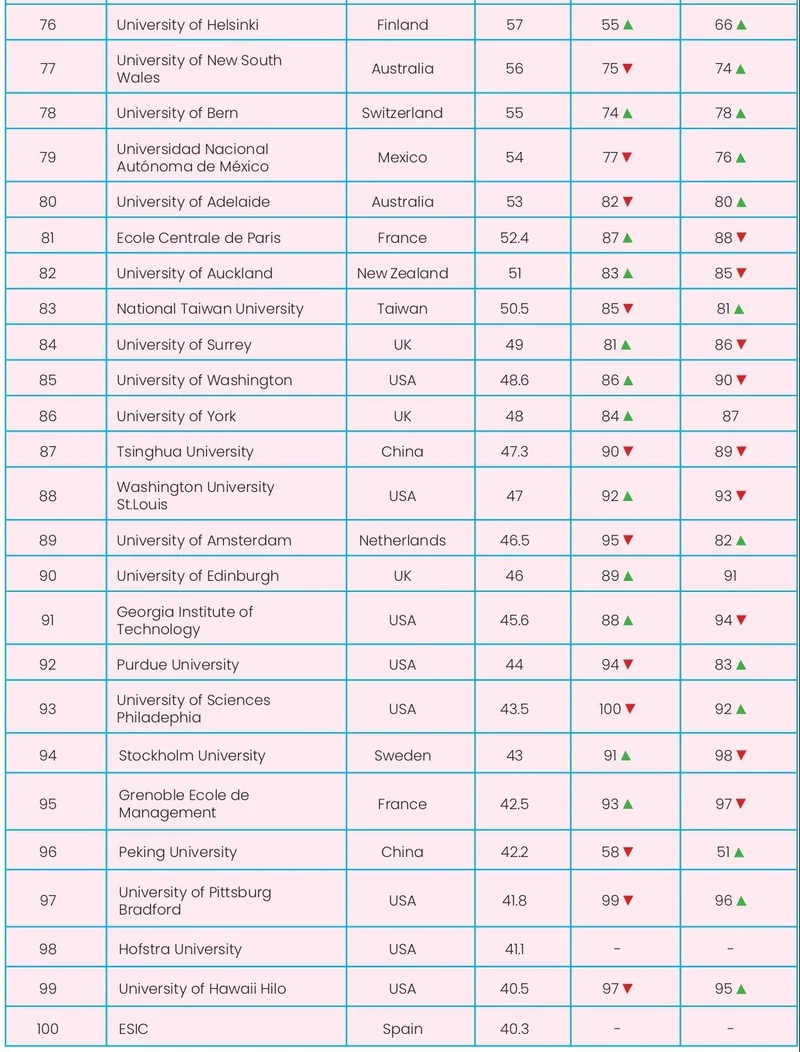
This year’s Undergraduate University Ranking hasn’t been well for India. While last year, the Indian Institute of Technology Bombay fell under the category of top 20 universities of the world ranking 17th, this year it has lost that rank. It now stands at 21st position. Speaking about the top 50 category, only two Indian institutes have managed to occupy ranks. One is IIT Bombay holding the 21st rank and the other is Indian Institute of Technology Delhi holding the 25th rank. For the third consecutive year, the same 4 universities have scored their place in this year’s universities ranking. The Indian Institute of Technology Kanpur has jumped to 61st rank from last year’s 64th rank and 2020’s 62nd rank. The University of Delhi has moved upwards on 75th position from 79th position in 2021 as well as 2022. There have been no new additions this year. With the second year showing just little improvement, Indian institutes need to do more to better their student’s experience.
Ranking Methodology
We chose institutes across the world after having discussions with thousands of students, recruiters and faculty. Youth Inc’s Research Unit (YRU) also studied domestic rankings in various countries to find the best institutes.
We sent survey links to 2555 institutes and provided them with unique codes so that they could submit their responses online. Institutes were also provided links to online surveys where their current students were asked to rate specific statements that pertained to the factors considered in this ranking. Institutes also sent separate survey links to their recruiters who in turn rated the institute’s career management cell as well as student employability.
Over 9500 additional recruiters were sent emails with a survey link. The recruiter list was prepared from the responses of the institutes and also included internationally well-known recruiters.
Below are the factors we considered and the overall weightage assigned to them:
Careers, Recruitment and Industry viability of students – 55%
Diversity and International Outlook – 10%
Innovation – 10%
Campus, Extracurricular activities, Exchange programmes – 15%
Money, Student Satisfaction – 10%
Careers, Recruitment and Industry viability of students – 55%
This category significantly impacts the overall score of an institute since it is the most weighted factor. One of the most important criterions to select institutes is the student’s industry viability after graduation.
Recruiters were asked to list and rate the institutes that they were most likely to recruit from. They were asked the likelihood of recruiting again from the same institute and their satisfaction with the institute’s career cell. Recruiters rated students on various factors including analytical and problem solving skills, leadership potential, communication and interpersonal skills and so on.
Institutes, students and alumni were also asked about the availability and functioning of a career service cell on campus and how active such a service was. We also considered what percentage of students were actually placed, both domestically and internationally, through the institute’s career service cell. Students reported the availability and ease of obtaining internships.
Diversity and International Outlook – 10%
This category looks not only at diversity of faculty but also at diversity of students in class. The international outlook includes international students that are attracted and retained by the institute.
Institutes were asked to report the total number of students on campus and what percentage of the students were international and speak two or more languages. Gender diversity of the students was considered.
Institutes also reported the percentage of the faculty that were international, hold a doctorate degree and accredited with their own publishing material along with the gender diversity of the faculty.
Students and alumni were asked to rate the student and faculty diversity in their class.
Innovation – 10%
This category looks at the innovation used to construct and teach programmes and how faculty engage the students; an important factor in the overall perception of an institute.
We considered the different ways in which an institute constructs programmes. Institutes were asked to select from a list different teaching methodologies that we considered innovative – some of these included company visits, dual or multiple majors and course collaborations between different departments at the institute. Our list was made after surveying students across different campuses worldwide.
Students were asked to report how satisfied they are with faculty who use innovative ways to teach subjects.
Campus, Extracurricular activities, Exchange programmes – 15%
This category considers the support students receive on campus and the availability of extracurricular activities. The exchange programmes offered by the institute and how actively students are encouraged to opt for such programmes was also considered.
We asked the institutes to select the different types of assistance provided by the student office or a similar body on campus. Our initial list was selected after surveying students across different campuses worldwide.
Students and alumni reported if they were encouraged by the institute to participate in different extracurricular activities on campus.
Institutes were asked to report the percentage of students that opted for exchange programs. We also considered the exchange students present on the institute’s campus.
Money, Student Satisfaction – 10%
This category takes into account a critical part of college education today – finances. And more importantly, how satisfied a student is with the institute.
We considered students’ opinions on whether a particular institute was perceived as ‘value for money’. We also asked institutes to state the percentage of students who received some sort of funding from the institutes.
Students and alumni were asked to rate their institutes on various factors including attitude of staff and professors, location, course content and so on and institutes were asked to report the graduation rate of students enrolled and what percentage of students transfer out of the institution.
Scores
We calculated the standard deviation and standard scores (Z scores) so that we could combine and analyse the data with more accuracy and reliability. Below is a summary of the factors and the weightage given to each factor when we ranked the institutes. Each factor was made up of a set of questions. The total percentage attributed to that factor was based on the average score of the responses multiplied by the assigned weightage. The total scores were then sorted from highest to lowest. The institute with the highest score was ranked first.
| . | Institute | Cureent students | Alumni |
| Career Service | 3% | 1% | 1% |
| Diversity of Faculty | 3% | 1% | 1% |
| Diversity of Students | 3% | 1% | 1% |
| Innovation of Programs | 3% | 1% | 1% |
| Innovation in Teaching Methodologies | 3% | 1% | 1% |
| Campus Support | 3% | 1% | 1% |
| Extracurricular Activities | 3% | 1% | 1% |
| Exchange Programs | 3% | 1% | 1% |
| Value for Money | 3% | 1% | 1% |
| Student Satisfaction | 3% | 1% | 1% |
| 30% | 10% | 10% |
| Recruiters | |
| Recall of institute where to recruit from | 20% |
| Likelihood of recruiting from same institute again | 20% |
| Satisfaction with institute career cell | 10% |
| 50% |
Not just numbers
After we calculated the total computed scores for the institutes, we subjectively analyzed the data provided by the institutes, current students, and recruiters. If we found discrepancies in the satisfaction scores and the subjective descriptions, we omitted the data. This happened in the case of 7 institutes.
Missing Data
In a few rare occasions, some institutes did not supply data for all the questions in the survey. When data was missing which affected factors which were low-weighted such as value for money or campus support, we entered an estimate between the average and the lowest value reported by the institute.
By following such a practice we did not excessively penalise an institution with a ‘zero’ for data that it could not provide. At the same time, the institute was not rewarded.
Exclusion of Institutes
We required that at least 20% of the class size (of any specific institute) answer the student survey. Hence, some institutes were disqualified from our ranking because of rack of responses to the student and/or alumni survey.
Institutes that did not fill out the survey reports in time
13% of the institutes contacted did not complete the survey on time or did not respond. We used publicly available information on some of these institutes to include them in our ranking. We also contacted current students and recruiters of these institutes and compared the data we received with the data from institutes that participated in our survey.