The landscape of global higher education continues to shift as universities adapt to an increasingly interconnected world. What was once a local decision about education has become a deeply global one. Students now consider not just academic strength, but also whether a university can connect them to opportunities across different continents, different industries, and different cultures. Universities themselves have responded by thinking beyond their home campuses, opening branches internationally and creating pathways for students to study in multiple locations during their degree.
February 2026 has been a game-changer for the IT industry, as roughly $830 billion in market value evaporated from global software stocks. That is roughly the entire GDP of Switzerland or the market cap of Tesla, vanishing into thin air.
Anthropic is a name that has taken the technology world by storm, emerging as a dominant force in the global tech landscape in just five years. The company recently launched a suite of specialised agent plugins targeting finance, engineering, legal, accounting, and HR functions. These tools won’t eliminate entire sectors overnight, but they will significantly reshape certain job categories.
So who is most at risk?
Repetitive + rule-based + digital work equals the highest risk.
- Coding and entry-level programmers, IT support
- Voice and chat support agents, BPO roles
- Entry-level accountants, research analysts
- Junior copywriters, SEO writers
- Paralegals, junior associates
Who is safest?
- Skilled trades such as electricians and plumbers
- Healthcare providers, including nurses and surgeons
- Hospitality and service roles
- Relationship-based roles
- People who combine AI tools with strong domain expertise
The 2026 rankings reflect the above evolution. At the top, we continue to see the same prestigious institutions maintaining their positions, but the story becomes more interesting as you move down the list. Universities are being judged not just on what they teach, but on how they prepare students for a world that values both technical skills and adaptability. The competition is intensifying, with institutions from different regions proving they can compete at the highest level.
One of the most significant shifts in higher education is the rise of universities with multiple locations. Institutions are no longer confined to a single campus in a single city. Instead, they’re creating pathways for students to experience education in different parts of the world during their undergraduate years.
Northeastern University has expanded its global footprint by operating campuses in multiple cities, including London and other international hubs. This allows students to have a genuine international experience without enrolling in multiple institutions. They can complete part of their degree in one location and another part in a completely different region, gaining exposure to different academic cultures and job markets simultaneously.
IE University has strengthened its position as a truly global institution. Beyond its traditional campus in Segovia and its presence in Madrid, IE has established operations in New York and other major cities, allowing it to offer students a worldwide network and diverse learning environments. This strategy has contributed to its consistently strong performance in the 2026 rankings.
Universities are competing on more than reputation now. They’re competing on access, flexibility, and the ability to connect students with global networks. This trend is likely to accelerate, with more institutions recognising that a physical presence in multiple regions is essential for attracting ambitious students.
Analysis
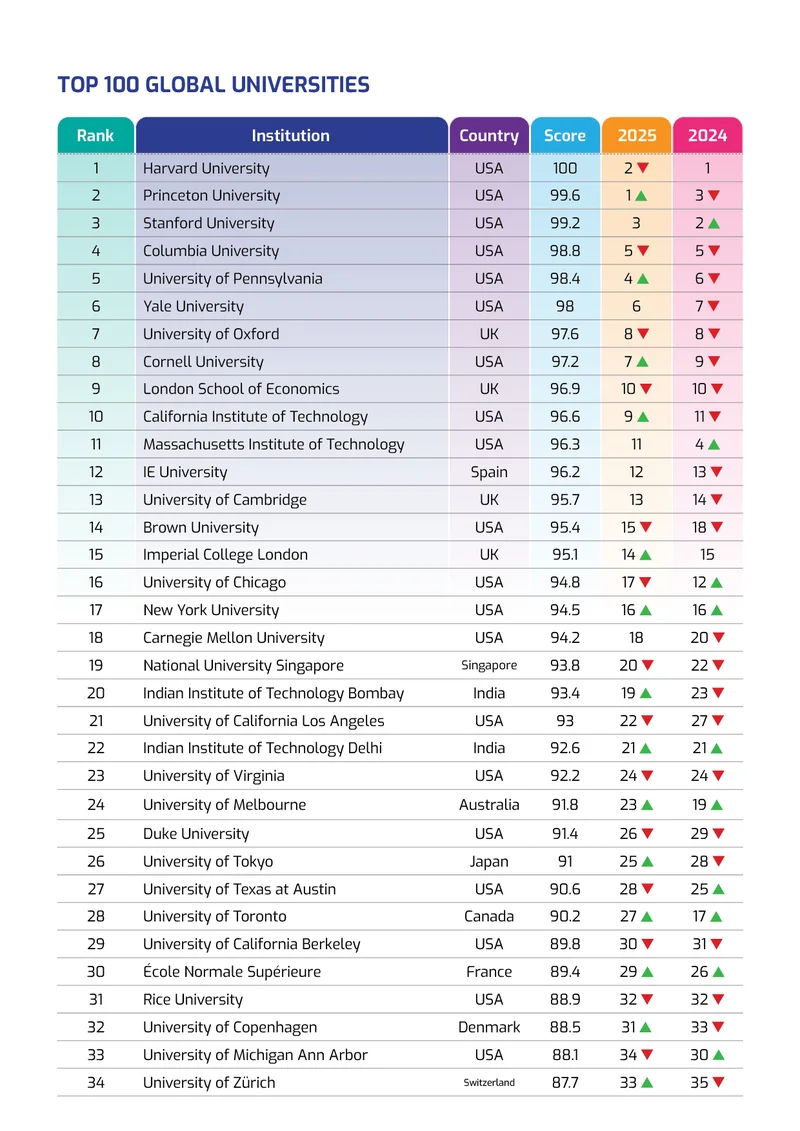
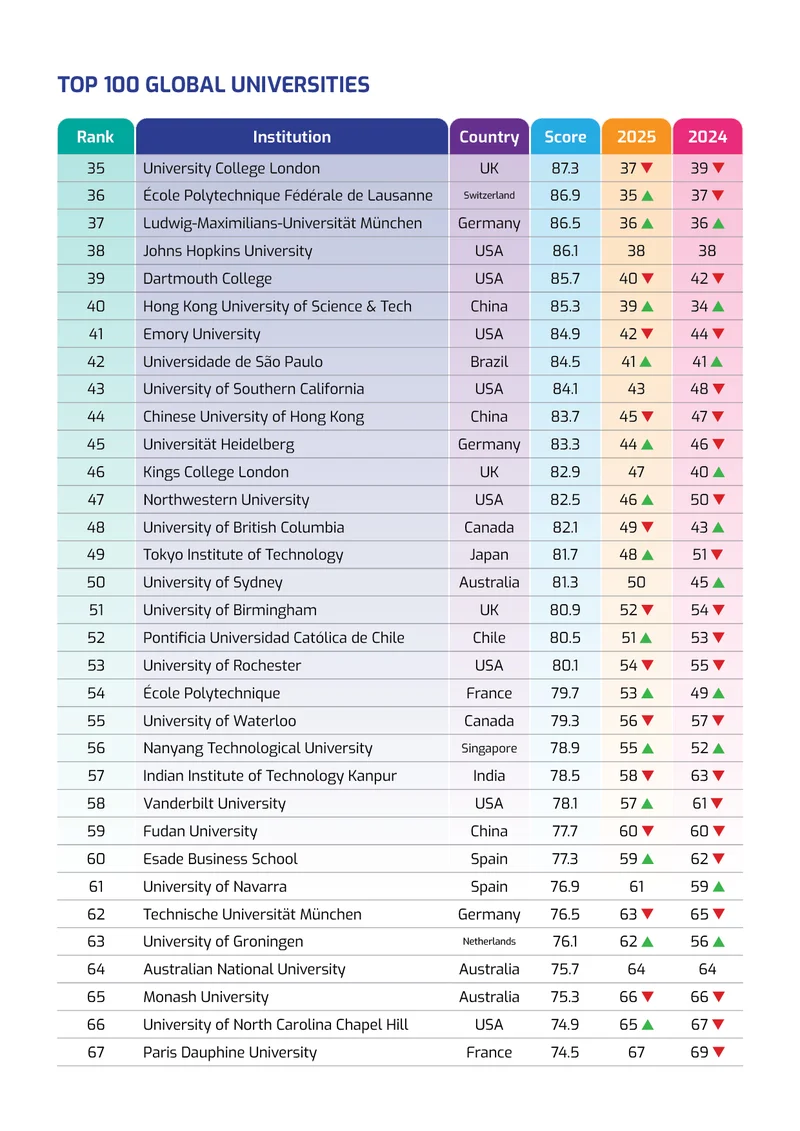
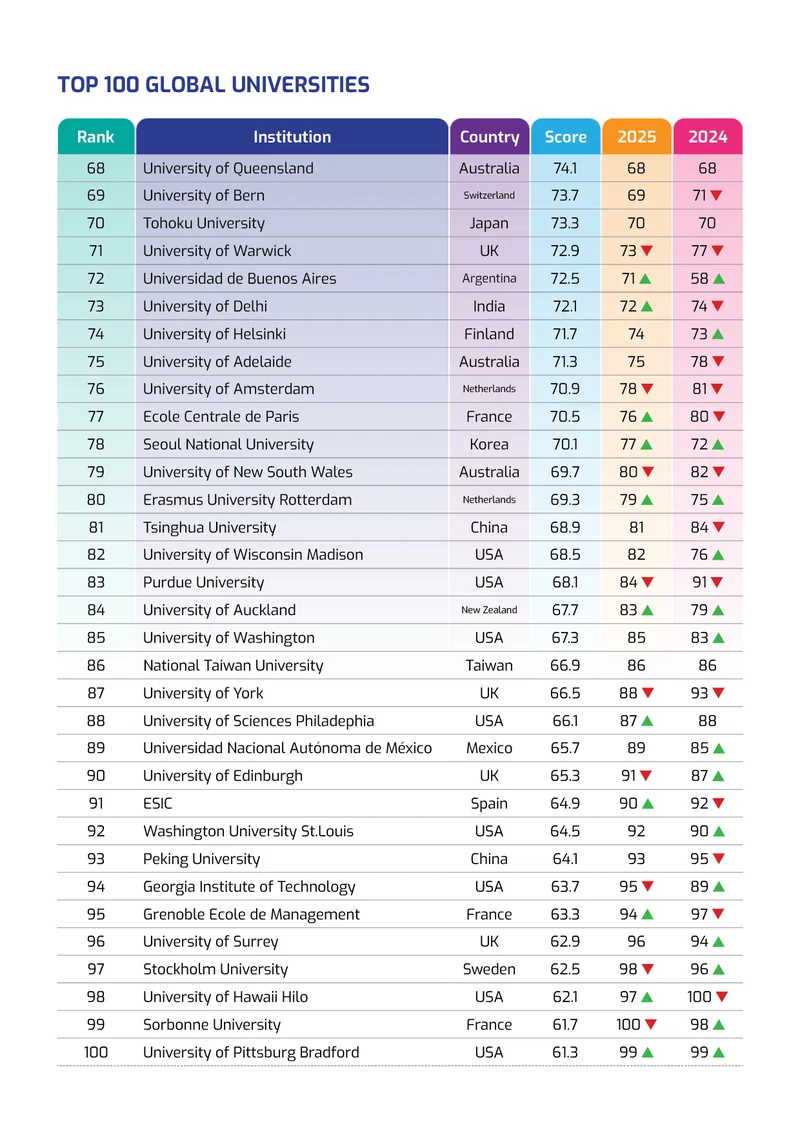
The Global University Rankings 2026 show stability at the top with some notable shifts in the middle range. Harvard University has secured the first position, with Princeton University and Stanford University holding onto second and third positions, respectively. This trio has remained remarkably consistent over the past few years, reinforcing their standing as the world’s leading undergraduate destinations.
Columbia University, University of Pennsylvania, and Yale University continue to occupy the fourth through sixth positions, solidifying the dominance of US institutions in the top tier. The University of Oxford maintains its strong showing in seventh place, while Cornell University holds firm in the eighth position.
The London School of Economics and California Institute of Technology round out the top ten, continuing to attract students from across the globe. What’s particularly striking is how consistent these rankings have become year over year. Rather than dramatic movements, we’re seeing incremental shifts that reflect gradual improvements in specific areas rather than fundamental changes in how these institutions operate.
MIT has shifted positions compared to previous years, now ranking 11th globally. This reflects the intense competition at the highest level, where even small variations in performance metrics can affect placement. The UK maintains a strong presence in the global top 20, with the University of Cambridge and Imperial College London continuing to attract serious international applicants.
How India Performed
India’s position in global higher education continues to grow, though progress remains uneven. For 2026, Indian institutions have shown mixed results. IIT Bombay maintains its position as the strongest Indian performer, ranking 20th globally, which represents a solid hold on its position from the previous year. IIT Delhi follows closely at 22nd position, demonstrating that India’s flagship institutes remain competitive on the world stage.
However, growth beyond the top tier has been limited. IIT Kanpur ranks 57th globally, while the University of Delhi comes in at 73rd. This pattern shows that while India’s top institutions are world-class, there is a significant gap before reaching the next tier of universities. The challenge for India’s higher education system is to strengthen the broader ecosystem, not just maintain excellence at the very top.
India remains the single largest source of international students for universities worldwide. In 2025 and 2026, Indian students continued their outbound migration, with a preference for countries offering clear pathways to work experience and permanent residency. The UK, Australia, Canada, and the United States remain top destinations. However, policy changes and visa restrictions in these countries have started to create headwinds for Indian applicants.
On the positive side, India has seen increased investment in education technology and skill development. Programs like the Pradhan Mantri Kaushal Vikas Yojana and the Skill India Digital Hub have expanded access to quality training in emerging fields like AI, data science, and digital marketing. Universities are also modernising their curricula to include interdisciplinary programs and industry partnerships, responding to the reality that today’s students need both breadth and specialisation.
The opening of international branch campuses in India is accelerating. With institutions like the University of Southampton planning to open campuses in Indian cities, Indian students now have greater access to globally recognised degrees without leaving the country. This trend is expected to reshape India’s higher education landscape significantly.
Ranking Methodology – Global Universities 2026
We chose institutes across the world after having discussions with thousands of students, recruiters and faculty. Youth Inc’s Research Unit (YRU) also studied domestic rankings in various countries to find the best institutes.
We sent survey links to 2667 institutes and provided them with unique codes so that they could submit their responses online. Institutes were also provided links to online surveys where their current students were asked to rate specific statements that pertained to the factors considered in this ranking. Institutes also sent separate survey links to their recruiters who in turn rated the institute’s career management cell as well as student employability.
Over 9750 additional recruiters were sent emails with a survey link. The recruiter list was prepared from the responses of the institutes and also included internationally well-known recruiters.
Below are the factors we considered and the overall weightage assigned to them:
Careers, Recruitment and Industry viability of students – 55%
Diversity and International Outlook – 10%
Innovation – 10%
Campus, Extracurricular activities, Exchange programmes – 15%
Money, Student Satisfaction – 10%
Careers, Recruitment and Industry viability of students – 55%
This category significantly impacts the overall score of an institute since it is the most weighted factor. One of the most important criterions to select institutes is the student’s industry viability after graduation.
Recruiters were asked to list and rate the institutes that they were most likely to recruit from. They were asked the likelihood of recruiting again from the same institute and their satisfaction with the institute’s career cell. Recruiters rated students on various factors including analytical and problem solving skills, leadership potential, communication and interpersonal skills and so on.
Institutes, students and alumni were also asked about the availability and functioning of a career service cell on campus and how active such a service was. We also considered what percentage of students were actually placed, both domestically and internationally, through the institute’s career service cell. Students reported the availability and ease of obtaining internships.
Diversity and International Outlook – 10%
This category looks not only at diversity of faculty but also at diversity of students in class. The international outlook includes international students that are attracted and retained by the institute.
Institutes were asked to report the total number of students on campus and what percentage of the students were international and speak two or more languages. Gender diversity of the students was considered.
Institutes also reported the percentage of the faculty that were international, hold a doctorate degree and accredited with their own publishing material along with the gender diversity of the faculty.
Students and alumni were asked to rate the student and faculty diversity in their class.
Innovation – 10%
This category looks at the innovation used to construct and teach programmes and how faculty engage the students; an important factor in the overall perception of an institute.
We considered the different ways in which an institute constructs programmes. Institutes were asked to select from a list different teaching methodologies that we considered innovative – some of these included company visits, dual or multiple majors and course collaborations between different departments at the institute. Our list was made after surveying students across different campuses worldwide.
Students were asked to report how satisfied they are with faculty who use innovative ways to teach subjects.
Campus, Extracurricular activities, Exchange programmes – 15%
This category considers the support students receive on campus and the availability of extracurricular activities. The exchange programmes offered by the institute and how actively students are encouraged to opt for such programmes was also considered.
We asked the institutes to select the different types of assistance provided by the student office or a similar body on campus. Our initial list was selected after surveying students across different campuses worldwide.
Students and alumni reported if they were encouraged by the institute to participate in different extracurricular activities on campus.
Institutes were asked to report the percentage of students that opted for exchange programs. We also considered the exchange students present on the institute’s campus.
Money, Student Satisfaction – 10%
This category takes into account a critical part of college education today – finances. And more importantly, how satisfied a student is with the institute.
We considered students’ opinions on whether a particular institute was perceived as ‘value for money’. We also asked institutes to state the percentage of students who received some sort of funding from the institutes.
Students and alumni were asked to rate their institutes on various factors including attitude of staff and professors, location, course content and so on and institutes were asked to report the graduation rate of students enrolled and what percentage of students transfer out of the institution.
Scores
We calculated the standard deviation and standard scores (Z scores) so that we could combine and analyse the data with more accuracy and reliability. Below is a summary of the factors and the weightage given to each factor when we ranked the institutes. Each factor was made up of a set of questions. The total percentage attributed to that factor was based on the average score of the responses multiplied by the assigned weightage. The total scores were then sorted from highest to lowest. The institute with the highest score was ranked first.
| . | Institute | Cureent students | Alumni |
| Career Service | 3% | 1% | 1% |
| Diversity of Faculty | 3% | 1% | 1% |
| Diversity of Students | 3% | 1% | 1% |
| Innovation of Programs | 3% | 1% | 1% |
| Innovation in Teaching Methodologies | 3% | 1% | 1% |
| Campus Support | 3% | 1% | 1% |
| Extracurricular Activities | 3% | 1% | 1% |
| Exchange Programs | 3% | 1% | 1% |
| Value for Money | 3% | 1% | 1% |
| Student Satisfaction | 3% | 1% | 1% |
| 30% | 10% | 10% |
| Recruiters | |
| Recall of institute where to recruit from | 20% |
| Likelihood of recruiting from same institute again | 20% |
| Satisfaction with institute career cell | 10% |
| 50% |
Not just numbers
After we calculated the total computed scores for the institutes, we subjectively analyzed the data provided by the institutes, current students, and recruiters. If we found discrepancies in the satisfaction scores and the subjective descriptions, we omitted the data. This happened in the case of 12 institutes.
Missing Data
In a few rare occasions, some institutes did not supply data for all the questions in the survey. When data was missing which affected factors which were low-weighted such as value for money or campus support, we entered an estimate between the average and the lowest value reported by the institute.
By following such a practice, we did not excessively penalize an institution with a ‘zero’ for data that it could not provide. At the same time, the institute was not rewarded.
Exclusion of Institutes
We required that at least 20% of the class size (of any specific institute) answer the student survey. Hence, some institutes were disqualified from our ranking because of rack of responses to the student and/or alumni survey.
Institutes that did not fill out the survey reports in time
13% of the institutes contacted did not complete the survey on time or did not respond. We used publicly available information on some of these institutes to include them in our ranking. We also contacted current students and recruiters of these institutes and compared the data we received with the data from institutes that participated in our survey.