The education sector is being redefined and redeveloped with technology deployment and bridging the learning gap worldwide. Universities all over the world have modified their policies to better suit the ever-changing needs of aspiring students and the new emerging careers in various fields and industries.
With the recent trends of upskilling and reskilling in career fields, it is evident that there is a gap between what the career industry wants and what the education sector is providing. This shows that universities now need to focus on aspects of sustainability, equity and social mobility, ethics, and transparency, along with societal value and impact.
With the introduction of immersive technologies in educational institutions, wrapped with the rapid digitalization of the world, universities worldwide are able to offer integrated ecosystems which have provided students with great opportunities in terms of learning.
A factor that has become extremely crucial to consider when choosing universities overseas is the geopolitical environment. With the Russia-Ukraine conflict in 2022, it has been seen that many students studying in those countries have been severely displaced and harassed. About 20,000 Indian students were forced to return back to India, and many are now making their way back to universities, even though the conflict still persists.
India has also seen various developments in the education sector which may help with university rankings in the coming years. India has for the first time made a new policy which will soon allow foreign universities and schools to open campuses in Gujarat International Finance Tec-City (GIFT City). This year’s Union Budget has seen an 8.2% increase in the allocation of funds for the education sector, as the government has set aside ₹1.12 lakh crore for the same. Considering the overall prioritization of education and youth affairs, the Indian picture is expected to improve with regard to its global standing. Although, it is crucial to note that even though change has started, the results will only be able to significantly impact the Indian standing after a few years, as this isn’t something that can happen overnight.
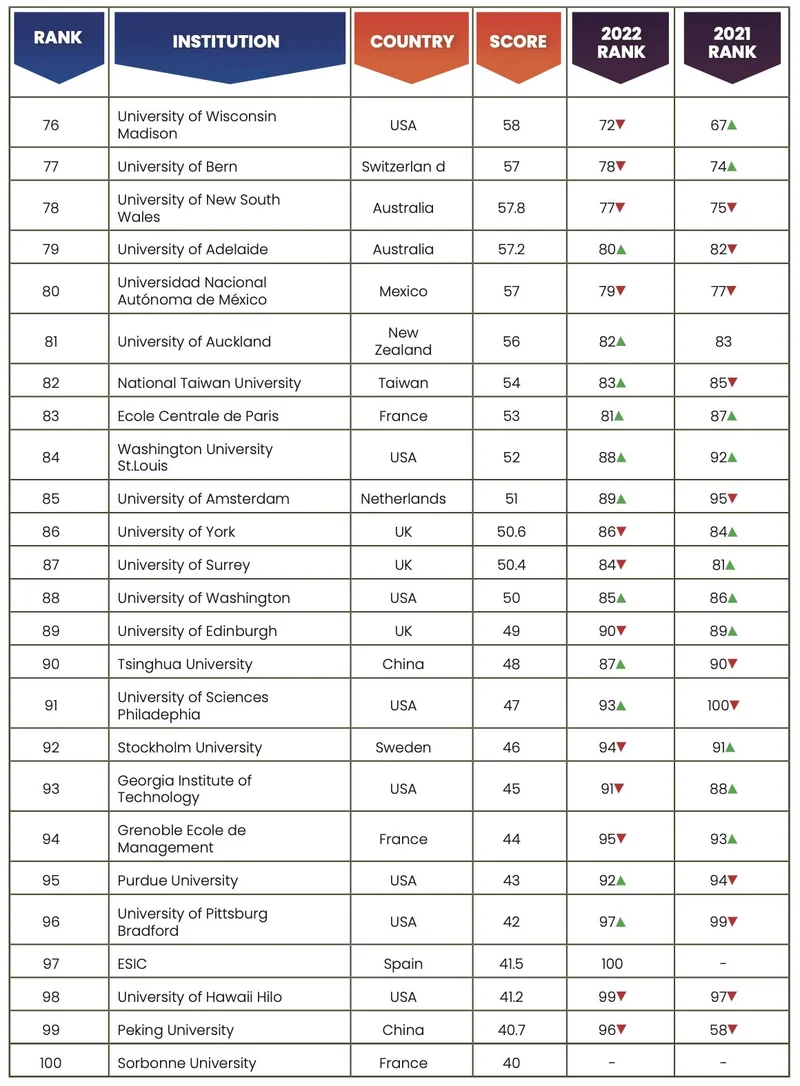
If you are a student wishing to pursue education on foreign shores, it is important for you to keep all these factors in mind before making your decision. To help with this, Youth Incorporated has released the top 100 Global Undergraduate University Rankings 2023 in association with The Times Of India. This list is curated with an immense amount of research to analyse the global reputation of many renowned universities, with the aim of helping students make informed decisions. The rankings are categorized based on the location and course specialization of these universities.
How Have The Universities Fared This Year As Compared To 2022 And 2021
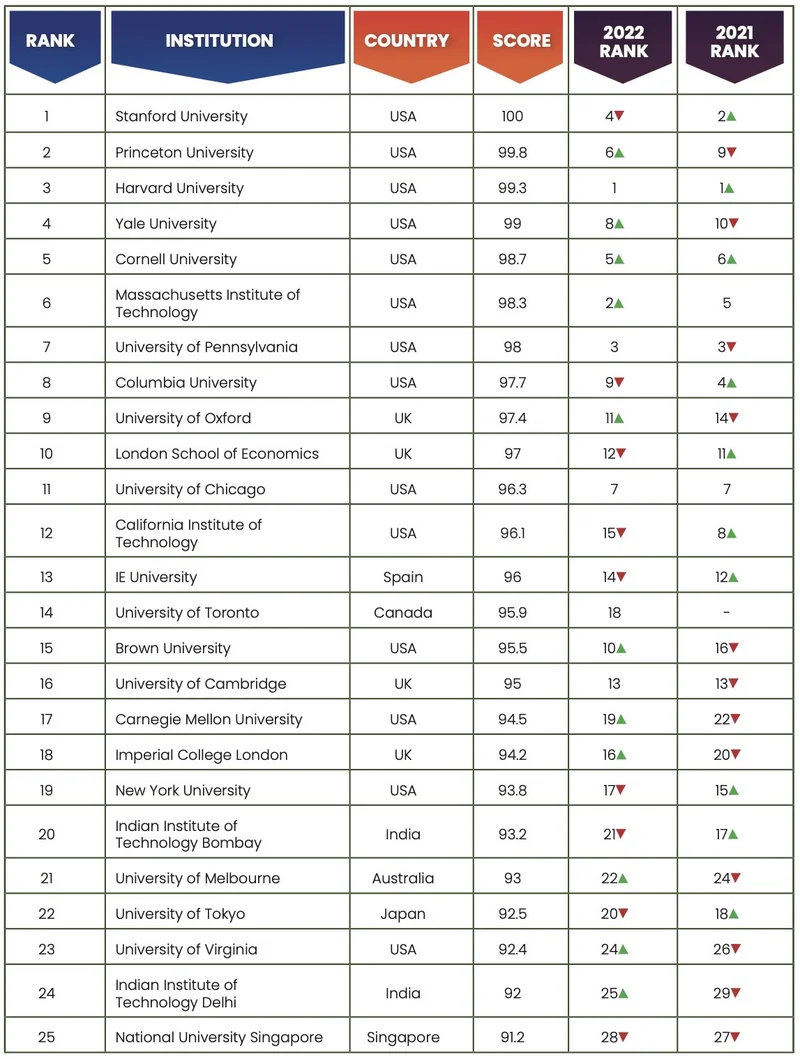
This year has seen a great shift in the rankings of universities. After holding the first position for two consecutive years, it is surprising to see that Harvard University has dropped to the third position this year. In its place, climbing up from the fourth position in 2022 is Stanford University which was ranked second in 2021. Princeton University has also taken a huge leap by jumping from the sixth position in 2022 to the second position this year. Yale University has been climbing slowly but steadily and has come up to the fourth position after being eighth in 2022 and tenth in 2021. Maintaining the same position as last year, Cornell University has ranked fifth this year as well. Two universities that saw a great drop in rankings are the Massachusetts Institute of Technology which has ranked sixth this year but was in second position in 2022, and the University of Pennsylvania which is currently in seventh place, but was third in 2022 and 2021. Columbia University has climbed up one rank from last year and is currently in eighth place. Two universities that have made it to the Top 10 Undergraduate Universities Of The World this year are the University of Oxford, which ranked ninth this year but was in the eleventh position last year, and the London School of Economics, which has jumped from the twelfth position in 2022 to the tenth position in 2023.
Even though there have been a lot of changes in the Top 10 Undergraduate Universities Of The World this year, it can still be seen that universities from the USA and UK are still the ones with hegemony over the other countries, making them the best study destinations for students to date.
What Does The Indian Picture Look Like?
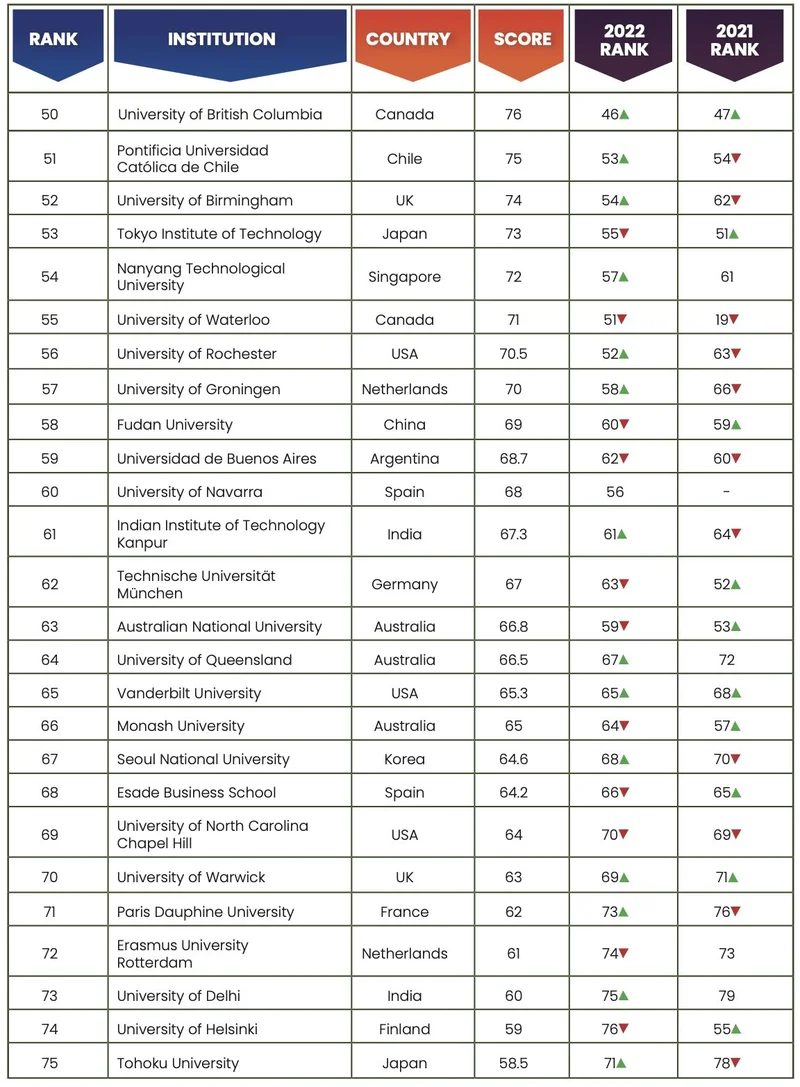
The Indian picture hasn’t seen that big of a change this year in terms of rankings. The same four universities have made their mark in the Top 100 Undergraduate Universities of The World and there have been no new additions this year. The Indian Institute of Technology, Bombay has made it to the Top 20 universities this year, which is an improvement from its 21st position in 2022. IIT Delhi has also jumped up a position, ranking 24th this year. Maintaining its 61st position from last year, IIT Kanpur has not dropped or gone up in terms of ranking this year. The University of Delhi has seen an improvement as it ranked 73rd this year, which is better than its last year’s ranking of 75. Even though there has not been a big change in the rankings for Indian universities, it is expected to get better in the coming years. What India lacks is state-of-the-art campuses, an updated curriculum, a diversity of students, and top-notch faculty with a global outlook. This can be made possible with the introduction of new policies and schemes focused on the education sector.
Ranking Methodology
We chose institutes across the world after having discussions with thousands of students, recruiters and faculty. Youth Inc’s Research Unit (YRU) also studied domestic rankings in various countries to find the best institutes.
We sent survey links to 2555 institutes and provided them with unique codes so that they could submit their responses online. Institutes were also provided links to online surveys where their current students were asked to rate specific statements that pertained to the factors considered in this ranking. Institutes also sent separate survey links to their recruiters who in turn rated the institute’s career management cell as well as student employability.
Over 9500 additional recruiters were sent emails with a survey link. The recruiter list was prepared from the responses of the institutes and also included internationally well-known recruiters.
Below are the factors we considered and the overall weightage assigned to them:
Careers, Recruitment and Industry viability of students – 55%
Diversity and International Outlook – 10%
Innovation – 10%
Campus, Extracurricular activities, Exchange programmes – 15%
Money, Student Satisfaction – 10%
Careers, Recruitment and Industry viability of students – 55%
This category significantly impacts the overall score of an institute since it is the most weighted factor. One of the most important criterions to select institutes is the student’s industry viability after graduation.
Recruiters were asked to list and rate the institutes that they were most likely to recruit from. They were asked about the likelihood of recruiting again from the same institute and their satisfaction with the institute’s career cell. Recruiters rated students on various factors including analytical and problem-solving skills, leadership potential, communication and interpersonal skills and so on.
Institutes, students and alumni were also asked about the availability and functioning of a career service cell on campus and how active such a service was. We also considered what percentage of students were actually placed, both domestically and internationally, through the institute’s career service cell. Students reported the availability and ease of obtaining internships.
Diversity and International Outlook – 10%
This category looks not only at diversity of faculty but also at diversity of students in class. The international outlook includes international students that are attracted and retained by the institute.
Institutes were asked to report the total number of students on campus and what percentage of the students were international and speak two or more languages. Gender diversity of the students was considered.
Institutes also reported the percentage of the faculty that were international, hold a doctorate degree and accredited with their own publishing material along with the gender diversity of the faculty.
Students and alumni were asked to rate the student and faculty diversity in their class.
Innovation – 10%
This category looks at the innovation used to construct and teach programmes and how faculty engage the students; an important factor in the overall perception of an institute.
We considered the different ways in which an institute constructs programmes. Institutes were asked to select from a list different teaching methodologies that we considered innovative – some of these included company visits, dual or multiple majors and course collaborations between different departments at the institute. Our list was made after surveying students across different campuses worldwide.
Students were asked to report how satisfied they are with faculty who use innovative ways to teach subjects.
Campus, Extracurricular activities, Exchange programmes – 15%
This category considers the support students receive on campus and the availability of extracurricular activities. The exchange programmes offered by the institute and how actively students are encouraged to opt for such programmes was also considered.
We asked the institutes to select the different types of assistance provided by the student office or a similar body on campus. Our initial list was selected after surveying students across different campuses worldwide.
Students and alumni reported if they were encouraged by the institute to participate in different extracurricular activities on campus.
Institutes were asked to report the percentage of students that opted for exchange programs. We also considered the exchange students present on the institute’s campus.
Money, Student Satisfaction – 10%
This category takes into account a critical part of college education today – finances. And more importantly, how satisfied a student is with the institute.
We considered students’ opinions on whether a particular institute was perceived as ‘value for money’. We also asked institutes to state the percentage of students who received some sort of funding from the institutes.
Students and alumni were asked to rate their institutes on various factors including attitude of staff and professors, location, course content and so on and institutes were asked to report the graduation rate of students enrolled and what percentage of students transfer out of the institution.
Scores
We calculated the standard deviation and standard scores (Z scores) so that we could combine and analyse the data with more accuracy and reliability. Below is a summary of the factors and the weightage given to each factor when we ranked the institutes. Each factor was made up of a set of questions. The total percentage attributed to that factor was based on the average score of the responses multiplied by the assigned weightage. The total scores were then sorted from highest to lowest. The institute with the highest score was ranked first.
| . | Institute | Current Students | Alumni |
| Career Service | 3% | 1% | 1% |
| Diversity of Faculty | 3% | 1% | 1% |
| Diversity of Students | 3% | 1% | 1% |
| Innovation of Programs | 3% | 1% | 1% |
| Innovation in Teaching Methodologies | 3% | 1% | 1% |
| Campus Support | 3% | 1% | 1% |
| Extracurricular Activities | 3% | 1% | 1% |
| Exchange Programs | 3% | 1% | 1% |
| Value for Money | 3% | 1% | 1% |
| Student Satisfaction | 3% | 1% | 1% |
| 30% | 10% | 10% |
| Recruiters | |
| Recall of institute where to recruit from | 20% |
| Likelihood of recruiting from same institute again | 20% |
| Satisfaction with institute career cell | 10% |
| 50% |
Not just numbers
After we calculated the total computed scores for the institutes, we subjectively analyzed the data provided by the institutes, current students, and recruiters. If we found discrepancies in the satisfaction scores and the subjective descriptions, we omitted the data. This happened in the case of 7 institutes.
Missing Data
In a few rare occasions, some institutes did not supply data for all the questions in the survey. When data was missing which affected factors which were low-weighted such as value for money or campus support, we entered an estimate between the average and the lowest value reported by the institute.
By following such a practice we did not excessively penalise an institution with a ‘zero’ for data that it could not provide. At the same time, the institute was not rewarded.
Exclusion of Institutes
We required that at least 20% of the class size (of any specific institute) answer the student survey. Hence, some institutes were disqualified from our ranking because of rack of responses to the student and/or alumni survey.
Institutes that did not fill out the survey reports in time
13% of the institutes contacted did not complete the survey on time or did not respond. We used publicly available information on some of these institutes to include them in our ranking. We also contacted current students and recruiters of these institutes and compared the data we received with the data from institutes that participated in our survey.