Scouring through thousands of colleges from across the globe is a pretty daunting task for students, and you are bound to be overwhelmed by the number of options at your disposal. Which is why we at Youth Incorporated, took it upon ourselves to give our readers an overview of the best colleges to pick from. After having conducted extensive research by contacting 2230 institutes and over 9000 recruiters around the world, we bring to you the top 100 universities in the world to pursue an undergraduate programme.
Welcome to the Youth Incorporated, Education Times and Rediff.com Global University Rankings 2018. Keeping up with our yearly rankings for the best global universities, we have conducted a thorough research across several months to sort through extensive raw data and bring out a practical analysis that can be helpful in the selection process for students looking to enrol in the top programmes the world over. We got in touch with 2230 institutes and recorded their unbiased responses to questions that would assist us in evaluating the quality of the educational experience provided by them. We also took into account the responses from the current students attending the universities, along with official responses from their respective administrative bodies. In order to make our rankings more relevant and credible, we accumulated responses from alumni of the institutes, and procured information from 9000 recruiters that have previously recruited graduates from the institutes considered in the surveys.
Once we gathered the adequate amount of data, we broke down the information by placing emphasis on the most important criteria a student considers when taking admission at an institute. Factors such as value for money, student and recruiter satisfaction, infrastructure and facilities, teaching methodologies and much more were considered to rank the institutes. This scrupulous method was employed by us to bring out the rankings of the top 100 universities worldwide. We were also able to provide rankings based on regional distribution and streams of study such as engineering, business, arts and humanities, pure sciences, and architecture. To give the readers a holistic view of how a particular institute has fared over the years, the ranking for this year was placed against our previously conducted annual rankings. We hope our in depth survey will guide students in making the right choice yet again!
TOP 100 UNIVERSITIES 2018
HOW HAVE THE UNIVERSITIES FARED COMPARED TO 2016 & 2017
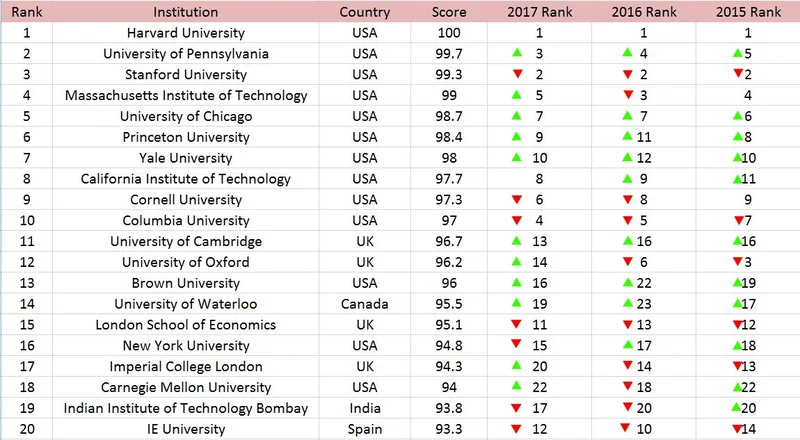
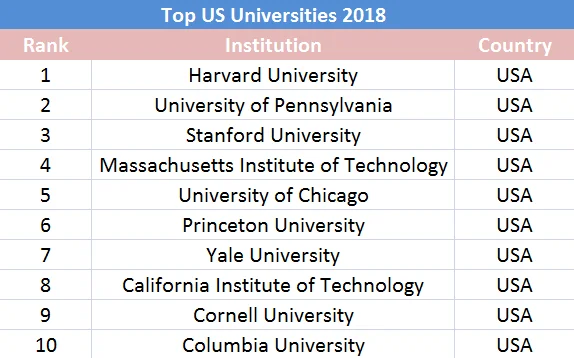
Placing the 2018 rankings against those we’ve conducted in the previous years, a comparison of performances over the years is eminent. Harvard University has retained top position with a perfect score that it has managed over the years as well. However, this year’s 2nd position surprised us yet again, and was claimed by the University of Pennsylvania with a near perfect score, pushing Stanford University one place down to the 3rd position. The University of Pennsylvania also moved up one rank last year.
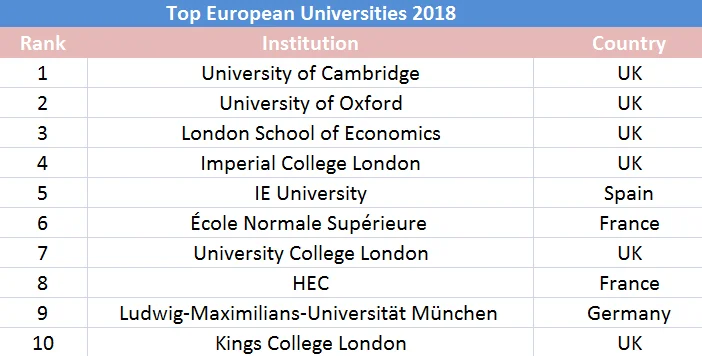
The Massachusetts Institute of Technology took 4th place sending last year’s 4th rank holder Columbia University down six positions at the 10th rank. Princeton University and Yale University that were new entrants to the top 10 last year also moved up the ranks this year occupying 6th and 7thposition respectively. Yet again this year, The University of Cambridge and The University of Oxford fell short of the top 10 ranking, but moved up two positions each from last year, at 11th and 12th rank respectively. Cornell University also dropped positions this year, with a 9th ranking as opposed to last year’s 6th ranking.
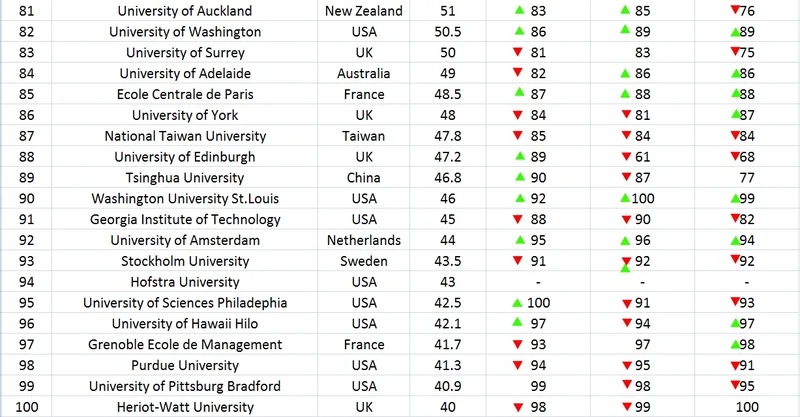
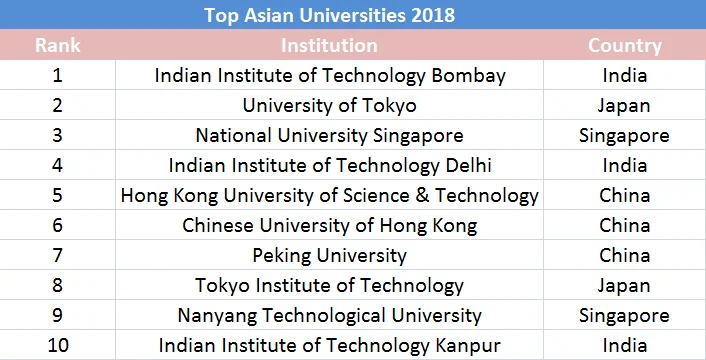
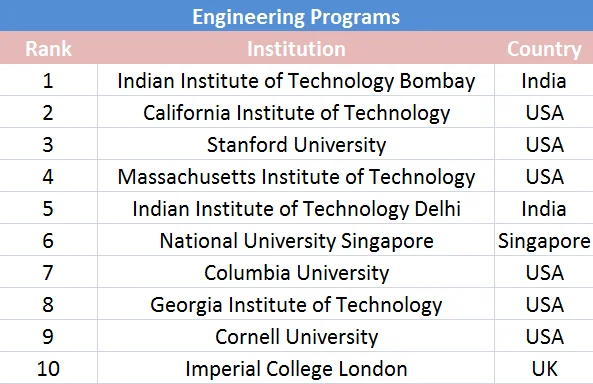
The American Institutes continued to dominate the top 10 as they did last year. Among Asian institutes, IIT Bombay is the only one to have made it to the top 20 this year. IE University rounded off the top 20 this year, but fell from its 12th place last year, to the 20th position. This year also saw the addition of new universities to the list – Hofstra University and University of Navarra. Upsala University and Bradley University who ranked at the 80th and 96th position respectively last year, didn’t make the cut to the top 100 this year.
THE INDIA STORY:
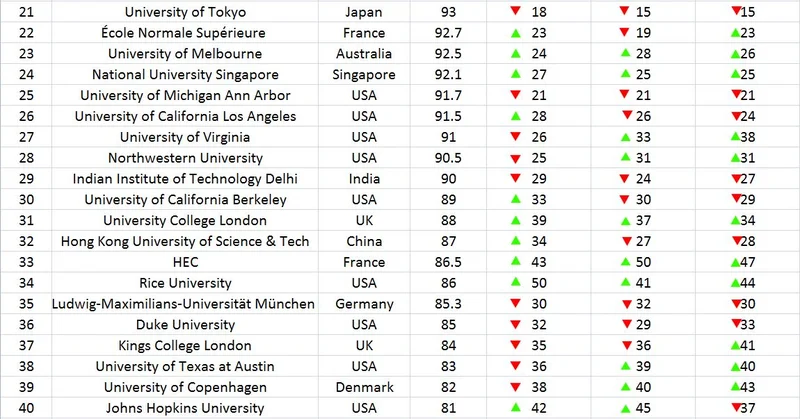
The 2018 Global Rankings have reflected a remarkable progress of two Indian institutes. The four institutes that have always appeared in our rankings are still the same and we haven’t seen any new colleges make it to the top 100 in the world. While the IIT Bombay has managed to retain itself in the top 20, it fell down two positions this year, coming in at 19th as opposed to last year’s 17th position. IIT Delhi has maintained the same 29th rank as last year. IIT Kanpur has shown remarkable growth once again, moving up to the 60th position from last year’s 64th rank. Like IIT Kanpur, the University of Delhi has also managed to jump up four positions from 79th rank to a considerable 75th rank. These four spaces’ jump is a reflection of the progress made by these institutes and we have seen it rising with every year!
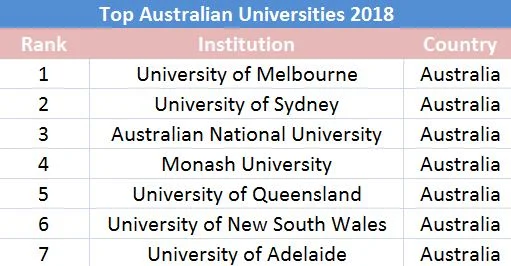
BEST REGIONAL UNIVERSITIES 2018:
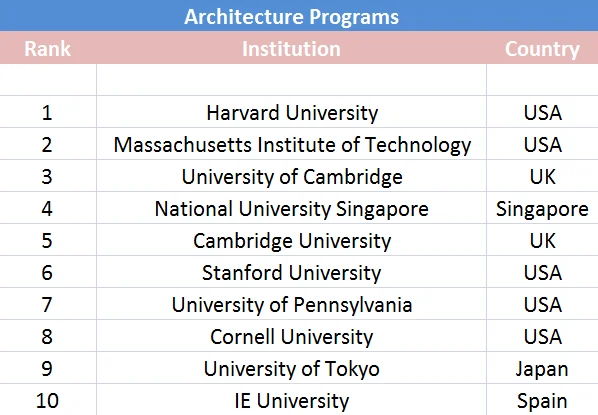
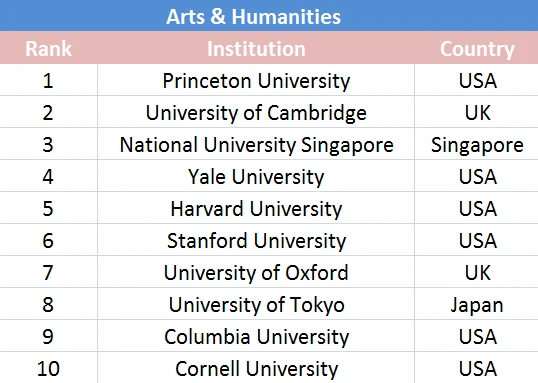
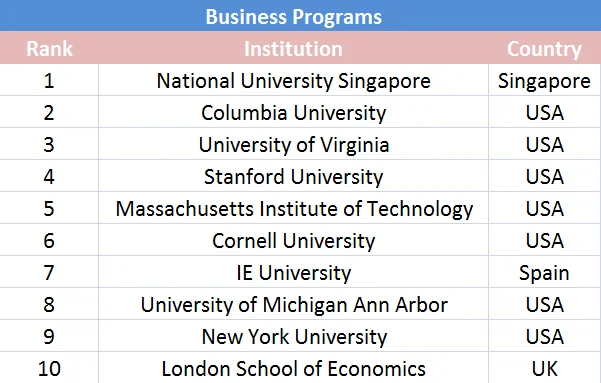
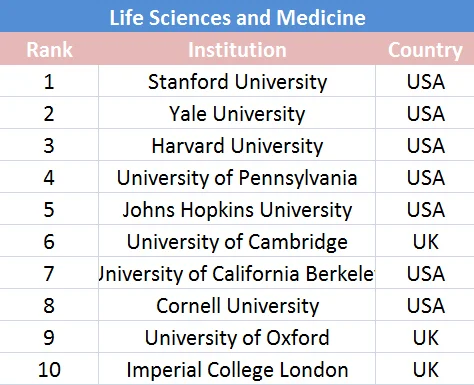
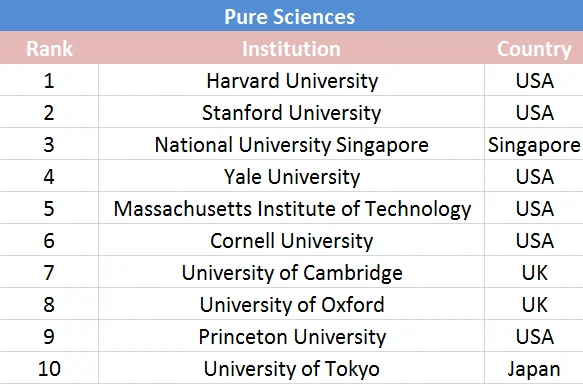
PROGRAM BASED RANKINGS
RANKING ANALYSIS
The teaching faculty at my institution are very receptive to discussions, questions and new ideas
70 per cent of students polled from our top 100 universities agreed that their teaching faculty was open to discussions, questions and new ideas. This is one of the best indicators of a good educational institute, so it is clear thatthe best institutes encourage interaction between the students and faculty.
The programmes taught in my institute and innovative and include company visits.
75 per cent of students at the top 100 institutes agreed that the programmes that they were taught were innovative. Education is constantly evolving, and the best institutes update their curricula regularly to keep in touch with the times.
My classmates enhance my learning experience by contributing to class discussions.
80 per cent of students polled felt that their learning experience was greatly enhanced by their peers’ contributions. The best institutes competitively select the best students, and learning at these top 100 is clearly enhanced by the quality of classroom discussions.
There is sufficient gender diversity in my class
60 per cent of students polled felt that the gender diversity in their classes was insufficient. These top institutes need to do more to encourage women to take up science and business related fields so encourage gender equality in society.
There is sufficient international diversity in my class.
70 per cent of students polled felt that the international diversity in their classes was sufficient. International diversity is a strong factor that attracts students from all over the world to study at these top institutes. In recent years, the numbers of scholarships offered to international students have been reduced and this trend needs to be checked to maintain a diverse classroom.
I feel that my institution provides value for the money I paid.
45 per cent of students polled felt that the institutes they were at did not provide value for money. The top 100 institutes in our rankings list are the most expensive to study at the world. With the economic crisis affecting most of the West and fluctuations in the Asian markets, it has become more difficult for gradates to find jobs. The institutes need to work harder to build up their career services and internship opportunities for students.
RANKING METHODOLOGY
We chose institutes across the world after having discussions with thousands of students, recruiters and faculty. Youth Inc’s Research Unit (YRU) also studied domestic rankings in various countries to find the best institutes.
We sent survey links to 2230 institutes and provided them with unique codes so that they could submit their responses online. Institutes were also provided links to online surveys where their current students were asked to rate specific statements that pertained to the factors considered in this ranking. Institutes also sent separate survey links to their recruiters who in turn rated the institute’s career management cell as well as student employability.
Over 9000 additional recruiters were sent emails with a survey link. The recruiter list was prepared from the responses of the institutes and also included internationally well-known recruiters.
Below are the factors we considered and the overall weightage assigned to them:
Careers, Recruitment and Industry viability of students – 55%
Diversity and International Outlook – 10%
Innovation – 10%
Campus, Extracurricular activities, Exchange programmes – 15%
Money, Student Satisfaction – 10%
Careers, Recruitment and Industry viability of students – 55%
This category significantly impacts the overall score of an institute since it is the most weighted factor. One of the most important criterions to select institutes is the student’s industry viability after graduation.
Recruiters were asked to list and rate the institutes that they were most likely to recruit from. They were asked the likelihood of recruiting again from the same institute and their satisfaction with the institute’s career cell. Recruiters rated students on various factors including analytical and problem solving skills, leadership potential, communication and interpersonal skills and so on.
Institutes, students and alumni were also asked about the availability and functioning of a career service cell on campus and how active such a service was. We also considered what percentage of students were actually placed, both domestically and internationally, through the institute’s career service cell. Students reported the availability and ease of obtaining internships.
Diversity and International Outlook – 10%
This category looks not only at diversity of faculty but also at diversity of students in class. The international outlook includes international students that are attracted and retained by the institute.
Institutes were asked to report the total number of students on campus and what percentage of the students were international and speak two or more languages. Gender diversity of the students was considered.
Institutes also reported the percentage of the faculty that were international, hold a doctorate degree and accredited with their own publishing material along with the gender diversity of the faculty.
Students and alumni were asked to rate the student and faculty diversity in their class.
Innovation – 10%
This category looks at the innovation used to construct and teach programmes and how faculty engage the students; an important factor in the overall perception of an institute.
We considered the different ways in which an institute constructs programmes. Institutes were asked to select from a list different teaching methodologies that we considered innovative – some of these included company visits, dual or multiple majors and course collaborations between different departments at the institute. Our list was made after surveying students across different campuses worldwide.
Students were asked to report how satisfied they are with faculty who use innovative ways to teach subjects.
Campus, Extracurricular activities, Exchange programmes – 15%
This category considers the support students receive on campus and the availability of extracurricular activities. The exchange programmes offered by the institute and how actively students are encouraged to opt for such programmes was also considered.
We asked the institutes to select the different types of assistance provided by the student office or a similar body on campus. Our initial list was selected after surveying students across different campuses worldwide.
Students and alumni reported if they were encouraged by the institute to participate in different extracurricular activities on campus.
Institutes were asked to report the percentage of students that opted for exchange programs. We also considered the exchange students present on the institute’s campus.
Money, Student Satisfaction – 10%
This category takes into account a critical part of college education today – finances. And more importantly, how satisfied a student is with the institute.
We considered students’ opinions on whether a particular institute was perceived as ‘value for money’. We also asked institutes to state the percentage of students who received some sort of funding from the institutes.
Students and alumni were asked to rate their institutes on various factors including attitude of staff and professors, location, course content and so on and institutes were asked to report the graduation rate of students enrolled and what percentage of students transfer out of the institution.
Scores
We calculated the standard deviation and standard scores (Z scores) so that we could combine and analyse the data with more accuracy and reliability. Below is a summary of the factors and the weightage given to each factor when we ranked the institutes. Each factor was made up of a set of questions. The total percentage attributed to that factor was based on the average score of the responses multiplied by the assigned weightage. The total scores were then sorted from highest to lowest. The institute with the highest score was ranked first.
| . | Institute | Cureent students | Alumni |
| Career Service | 3% | 1% | 1% |
| Diversity of Faculty | 3% | 1% | 1% |
| Diversity of Students | 3% | 1% | 1% |
| Innovation of Programs | 3% | 1% | 1% |
| Innovation in Teaching Methodologies | 3% | 1% | 1% |
| Campus Support | 3% | 1% | 1% |
| Extracurricular Activities | 3% | 1% | 1% |
| Exchange Programs | 3% | 1% | 1% |
| Value for Money | 3% | 1% | 1% |
| Student Satisfaction | 3% | 1% | 1% |
| 30% | 10% | 10% |
| Recruiters | |
| Recall of institute where to recruit from | 20% |
| Likelihood of recruiting from same institute again | 20% |
| Satisfaction with institute career cell | 10% |
| 50% |
Not just numbers
After we calculated the total computed scores for the institutes, we subjectively analyzed the data provided by the institutes, current students, and recruiters. If we found discrepancies in the satisfaction scores and the subjective descriptions, we omitted the data. This happened in the case of 5 institutes.
Missing Data
In a few rare occasions, some institutes did not supply data for all the questions in the survey. When data was missing which affected factors which were low-weighted such as value for money or campus support, we entered an estimate between the average and the lowest value reported by the institute.
By following such a practice we did not excessively penalise an institution with a ‘zero’ for data that it could not provide. At the same time, the institute was not rewarded.
Exclusion of Institutes
We required that at least 20% of the class size (of any specific institute) answer the student survey. Hence, some institutes were disqualified from our ranking because of lack of responses to the student and/or alumni survey.
Institutes that did not fill out the survey reports in time
13% of the institutes contacted did not complete the survey on time or did not respond. We used publicly available information on some of these institutes to include them in our ranking. We also contacted current students and recruiters of these institutes and compared the data we received with the data from institutes that participated in our survey.
For further information and complete list of rankings visit https://www.youthincmag.com/rankings