A successful career is built on the foundations of education and development, which are closely related. While development focuses on the process of growth, both personally and professionally, education gives people the information and abilities they need to succeed in the world. Young people today approach their careers knowing that they are entering a competitive field. It’s critical for people to realize that success demands more than just a degree at a time when industries and the labor market are rapidly changing. The secret is to connect career opportunities with passions and gain the necessary, in-demand skills.
Today’s young brains approach career planning with more nuance, frequently driven by the belief that the most crucial element is landing a job they love. Many young people are looking for a variety of experiences to find what really speaks to them, rather than following conventional career paths. This makes them sustain in a successful position and helps them find careers they are enthusiastic about. The idea is to pursue your passion, and then the success will follow. With the understanding that career advancement is a continuous process, the focus is on self-improvement and continuous learning. By trying different paths, expressing their true selves, young individuals can navigate their paths to meaningful and prosperous careers.
The quick development of technology is causing a significant shift in the education sector. We must take this into account that artificial intelligence (AI) has surely played a significant role in change. Globally, advanced analytics, virtual learning environments, and digital tools are revolutionizing higher education. Technologies like virtual reality (VR) and augmented reality (AR) have revolutionized the classroom by enabling students to engage with their lessons in new and interesting ways. These developments open up entirely new possibilities for both the educators and students.
The scope of traditional education is getting expanded because of new academic disciplines, technological advancements, and creative courses. In order to prepare students for jobs that did not exist ten years ago, courses in artificial intelligence, machine learning, blockchain technology, and sustainable energy solutions are becoming more and more crucial in today’s world. Universities are redefining what it means to offer a comprehensive education by incorporating interdisciplinary courses that integrate technology with disciplines like business, healthcare, and the arts. This shift is a direct response to the changing needs of the global labor market, which highly values new technologies and skills.
Furthermore, the increasing focus on online learning platforms and hybrid education models is enhancing accessibility in education. Students now have the chance to engage themselves with a high-quality education without the necessarily being on campus. Platforms powered by AI provide customized learning experiences, allowing students to progress at their own pace. Educational institutions worldwide are not only adopting technologies but also offering specialized courses. They are also re-evaluating the very nature of education. As the educational landscape evolves, universities are increasingly equipped to prepare students with the crucial skills needed to thrive in a connected, technology-driven world.
Students these days believe that different courses give them the opportunity to create their own career paths, their popularity will only increase. A student of gender studies can choose to work as a social activist, human resource manager, or in a law firm. In a similar vein, a graduate in public policy may pursue careers as a PR and marketing manager, government relations manager, or journalist. While selecting courses to study abroad, students are placing a higher value on independence, travel opportunities, and living life on their terms. We are in a world where the significance of technology and digital transformations is extremely valued so professional courses like robotics, data science, machine learning, and artificial learning are also top.
In the past few years, universities across the world have opened campuses worldwide in order provide diverse educational experience to students across different streams. Northeastern University has opened campuses in cities such as Toronto, Vancouver, and London, while also partnering with institutions in Asia and Europe. Similarly, Babson College has partnered with universities in China, India, and the Middle East to offer entrepreneurship-focused programs to students across the globe. IE University has established a New York campus, expanding its presence beyond Spain and offering students an international, dynamic environment to pursue business and management education. These global expansions encourage cross-cultural collaboration, research opportunities, and international career pathways.
With these changes, the landscape of higher education continues to evolve rapidly. As universities embrace new technologies, strengthen global connections, and offer more flexible learning opportunities, prospective students must stay informed about the most suitable institutions for their educational and professional goals. To help with this, Youth Incorporated has released the top 100 Global Undergraduate University Rankings 2025 in association with The Times of India. This list is curated with an immense amount of research to analyse the global reputation of many renowned universities, with the aim of helping students make informed decisions.
Analytics:
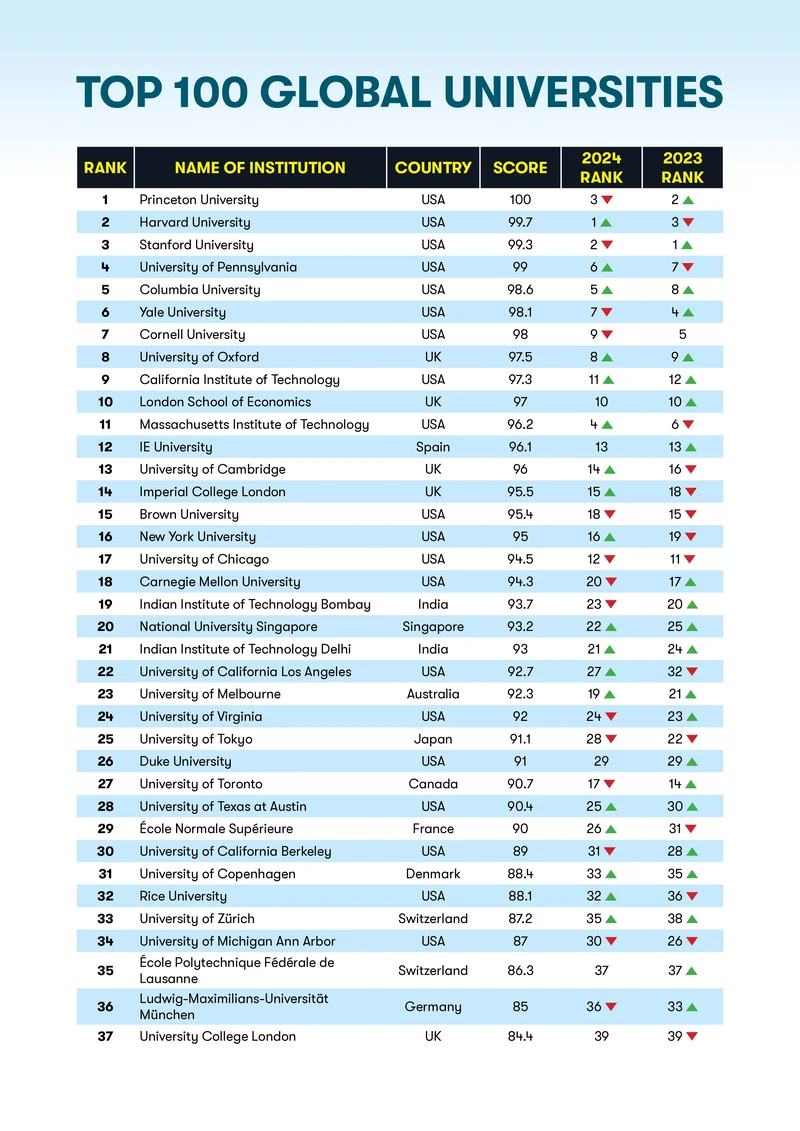
The Global University Rankings 2025 haven’t seen a lot of shift this year for universities. Princeton University has reclaimed the first position this year after it fell to third in 2024. In the second position is the Harvard University, which lost its crown from the first position from 2024. Stanford University has ranked third this Year after ranking second in 2024 and first in 2023. Climbing Up the ladder after falling sixth in 2024 and seventh in 2024, University of Pennsylvania has ranked forth this year. Columbia University has sustained it’s position by placing itself in the fifth rank this year. Yale University has ranked sixth this year, after ranking seventh in 2024. Placing itself in the seventh position, Climbing Up 2 ranks from last year, Cornell University is going up slowly and steadily. University of Oxford has sustained its position to the eighth rank. California institute of technology has dropped down to ninth this year, after holding eleventh rank last year. The London school of business has held its tenth position this year as well, staying in the top 10 global University Rankings in 2024. It is evident that the UK and the USA still hold hegemony over the top 10 universities, keeping them the best study destinations for students to date.
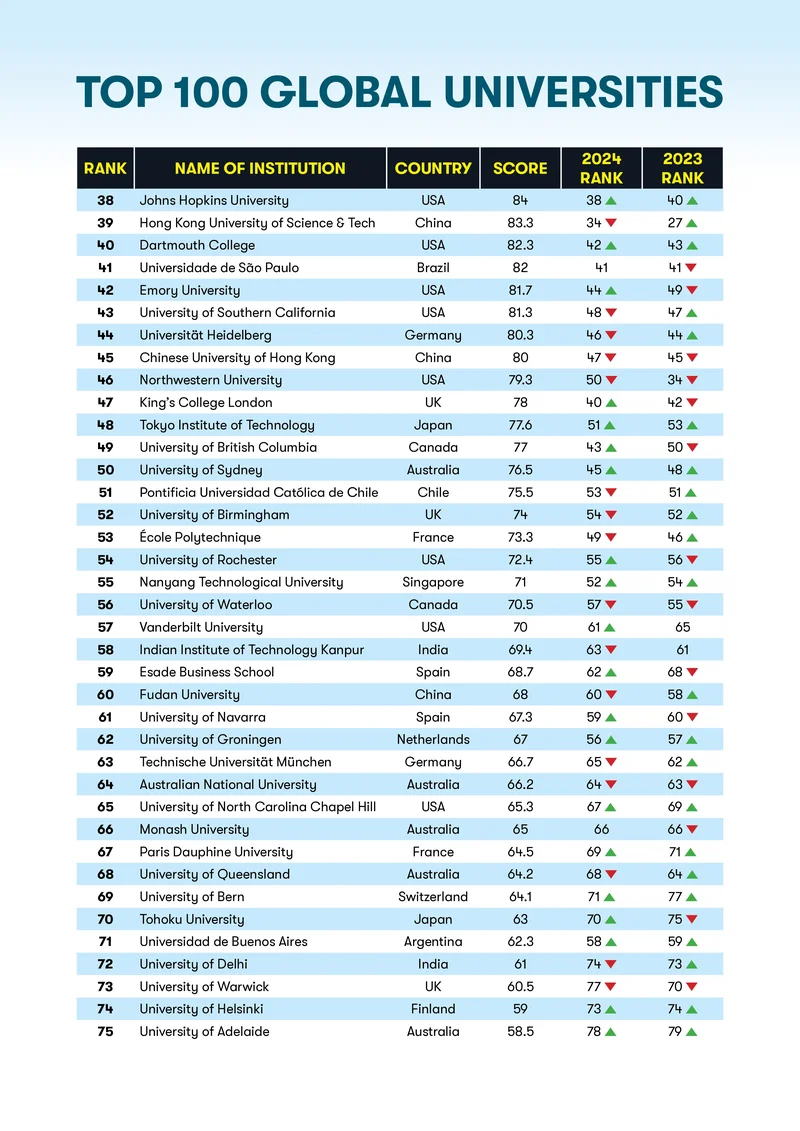
For 2025, Indian universities have shown some improvements, with IIT Bombay climbing up to the 19th position in the global undergraduate rankings, marking a significant rise from its 23rd position in 2024. IIT Delhi has also seen a steady improvement, ranking 21st this year, up from 22nd in 2024. However, IIT Kanpur has dropped slightly, ranking 58th in 2025 after being placed 63rd in 2024. Similarly, the University of Delhi has remained relatively stable, ranking 72nd in 2025, up from 74th in 2024. While these rankings show some progress, Indian universities still face challenges in meeting the growing demands of students and the expectations of global academic standards.
Ranking Methodology:
We chose institutes across the world after having discussions with thousands of students, recruiters and faculty. Youth Inc’s Research Unit (YRU) also studied domestic rankings in various countries to find the best institutes.
We sent survey links to 2622 institutes and provided them with unique codes so that they could submit their responses online. Institutes were also provided links to online surveys where their current students were asked to rate specific statements that pertained to the factors considered in this ranking. Institutes also sent separate survey links to their recruiters who in turn rated the institute’s career management cell as well as student employability.
Over 9550 additional recruiters were sent emails with a survey link. The recruiter list was prepared from the responses of the institutes and also included internationally well-known recruiters.
Below are the factors we considered and the overall weightage assigned to them:
Careers, Recruitment and Industry viability of students – 55%
Diversity and International Outlook – 10%
Innovation – 10%
Campus, Extracurricular activities, Exchange programmes – 15%
Money, Student Satisfaction – 10%
Careers, Recruitment and Industry viability of students – 55%
This category significantly impacts the overall score of an institute since it is the most weighted factor. One of the most important criterions to select institutes is the student’s industry viability after graduation.
Recruiters were asked to list and rate the institutes that they were most likely to recruit from. They were asked the likelihood of recruiting again from the same institute and their satisfaction with the institute’s career cell. Recruiters rated students on various factors including analytical and problem solving skills, leadership potential, communication and interpersonal skills and so on.
Institutes, students and alumni were also asked about the availability and functioning of a career service cell on campus and how active such a service was. We also considered what percentage of students were actually placed, both domestically and internationally, through the institute’s career service cell. Students reported the availability and ease of obtaining internships.
Diversity and International Outlook – 10%
This category looks not only at diversity of faculty but also at diversity of students in class. The international outlook includes international students that are attracted and retained by the institute.
Institutes were asked to report the total number of students on campus and what percentage of the students were international and speak two or more languages. Gender diversity of the students was considered.
Institutes also reported the percentage of the faculty that were international, hold a doctorate degree and accredited with their own publishing material along with the gender diversity of the faculty.
Students and alumni were asked to rate the student and faculty diversity in their class.
Innovation – 10%
This category looks at the innovation used to construct and teach programmes and how faculty engage the students; an important factor in the overall perception of an institute.
We considered the different ways in which an institute constructs programmes. Institutes were asked to select from a list different teaching methodologies that we considered innovative – some of these included company visits, dual or multiple majors and course collaborations between different departments at the institute. Our list was made after surveying students across different campuses worldwide.
Students were asked to report how satisfied they are with faculty who use innovative ways to teach subjects.
Campus, Extracurricular activities, Exchange programmes – 15%
This category considers the support students receive on campus and the availability of extracurricular activities. The exchange programmes offered by the institute and how actively students are encouraged to opt for such programmes was also considered.
We asked the institutes to select the different types of assistance provided by the student office or a similar body on campus. Our initial list was selected after surveying students across different campuses worldwide.
Students and alumni reported if they were encouraged by the institute to participate in different extracurricular activities on campus.
Institutes were asked to report the percentage of students that opted for exchange programs. We also considered the exchange students present on the institute’s campus.
Money, Student Satisfaction – 10%
This category takes into account a critical part of college education today – finances. And more importantly, how satisfied a student is with the institute.
We considered students’ opinions on whether a particular institute was perceived as ‘value for money’. We also asked institutes to state the percentage of students who received some sort of funding from the institutes.
Students and alumni were asked to rate their institutes on various factors including attitude of staff and professors, location, course content and so on and institutes were asked to report the graduation rate of students enrolled and what percentage of students transfer out of the institution.
Scores
We calculated the standard deviation and standard scores (Z scores) so that we could combine and analyse the data with more accuracy and reliability. Below is a summary of the factors and the weightage given to each factor when we ranked the institutes. Each factor was made up of a set of questions. The total percentage attributed to that factor was based on the average score of the responses multiplied by the assigned weightage. The total scores were then sorted from highest to lowest. The institute with the highest score was ranked first.
| . | Institute | Cureent students | Alumni |
| Career Service | 3% | 1% | 1% |
| Diversity of Faculty | 3% | 1% | 1% |
| Diversity of Students | 3% | 1% | 1% |
| Innovation of Programs | 3% | 1% | 1% |
| Innovation in Teaching Methodologies | 3% | 1% | 1% |
| Campus Support | 3% | 1% | 1% |
| Extracurricular Activities | 3% | 1% | 1% |
| Exchange Programs | 3% | 1% | 1% |
| Value for Money | 3% | 1% | 1% |
| Student Satisfaction | 3% | 1% | 1% |
| 30% | 10% | 10% |
| Recruiters | |
| Recall of institute where to recruit from | 20% |
| Likelihood of recruiting from same institute again | 20% |
| Satisfaction with institute career cell | 10% |
| 50% |
Not just numbers
After we calculated the total computed scores for the institutes, we subjectively analyzed the data provided by the institutes, current students, and recruiters. If we found discrepancies in the satisfaction scores and the subjective descriptions, we omitted the data. This happened in the case of 14 institutes.
Missing Data
In a few rare occasions, some institutes did not supply data for all the questions in the survey. When data was missing which affected factors which were low-weighted such as value for money or campus support, we entered an estimate between the average and the lowest value reported by the institute.
By following such a practice, we did not excessively penalize an institution with a ‘zero’ for data that it could not provide. At the same time, the institute was not rewarded.
Exclusion of Institutes
We required that at least 20% of the class size (of any specific institute) answer the student survey. Hence, some institutes were disqualified from our ranking because of rack of responses to the student and/or alumni survey.
Institutes that did not fill out the survey reports in time
16% of the institutes contacted did not complete the survey on time or did not respond. We used publicly available information on some of these institutes to include them in our ranking. We also contacted current students and recruiters of these institutes and compared the data we received with the data from institutes that participated in our survey.